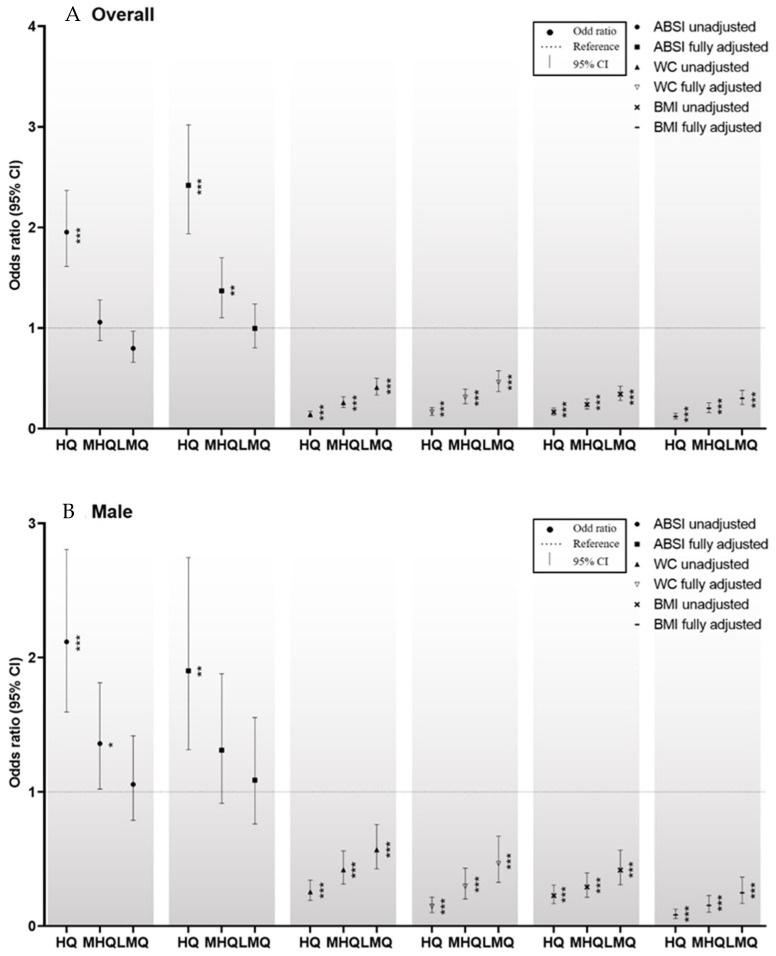
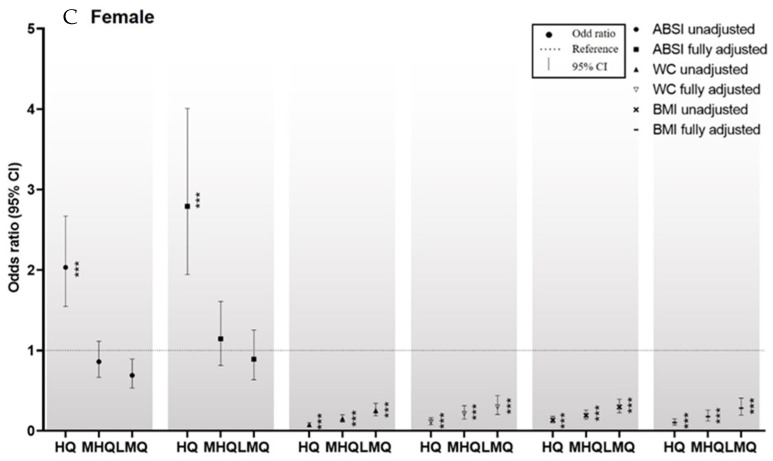
Figure 4.
(A–C) Comparisons of the ORs for men, women, and the entire group for the relationships of the Z-scores of ABSI, WC, and BMI with osteoporosis. * p < 0.05, ** p < 0.01, and *** p < 0.001 for the ORs for osteoporosis, compared with the lowest quartile. Abbreviations: HQ, highest quartile; MHQ, middle-high quartile; LMQ, low-middle quartile. The ORs for the entire group for the relationships between the Z-scores for WC, BMI, and ABSI and osteoporosis are shown in Figure 4A. Depending on their Z-scores for WC, BMI, and ABSI, the participants were placed into quartiles. In the case of the Z-score for ABSI, in the unadjusted model, and compared to the lowest quartile, the highest quartile had an OR of 1.954 (95% CI: 1.613–2.367) for osteoporosis. In the fully adjusted model, and compared to the lowest quartile, the highest and middle-high quartiles had ORs of 2.202 (1.771–2.737) and 1.282 (1.036–1.585), respectively. As regards to the Z-score for WC, in the unadjusted model, and compared to the lowest quartile, the low-middle, middle-high, and highest quartiles showed ORs of 0.410 (0.335–0.503), 0.258 (0.211–0.317) and 0.142 (0.115–0.175), respectively for osteoporosis. In the fully adjusted model, and compared to the lowest quartile, the low-middle, middle-high, and highest quartiles had ORs of 0.461 (0.368–0.577), 0.313 (0.249–0.393), and 0.166 (0.131–0.210), respectively, for osteoporosis. With respect to the Z-score for BMI, in the unadjusted model, and compared to the lowest quartile, the low-middle, middle-high, and highest quartiles had ORs of 0.344 (0.280–0.421), 0.240 (0.195–0.294), and 0.166 (0.135–0.205), respectively, for osteoporosis. In the fully adjusted model, and compared to the lowest quartile, the low-middle, middle-high, and highest quartiles had ORs of 0.302 (0.240–0.380), 0.203 (0.160–0.256), and 0.120 (0.095–0.153), respectively, for osteoporosis.


