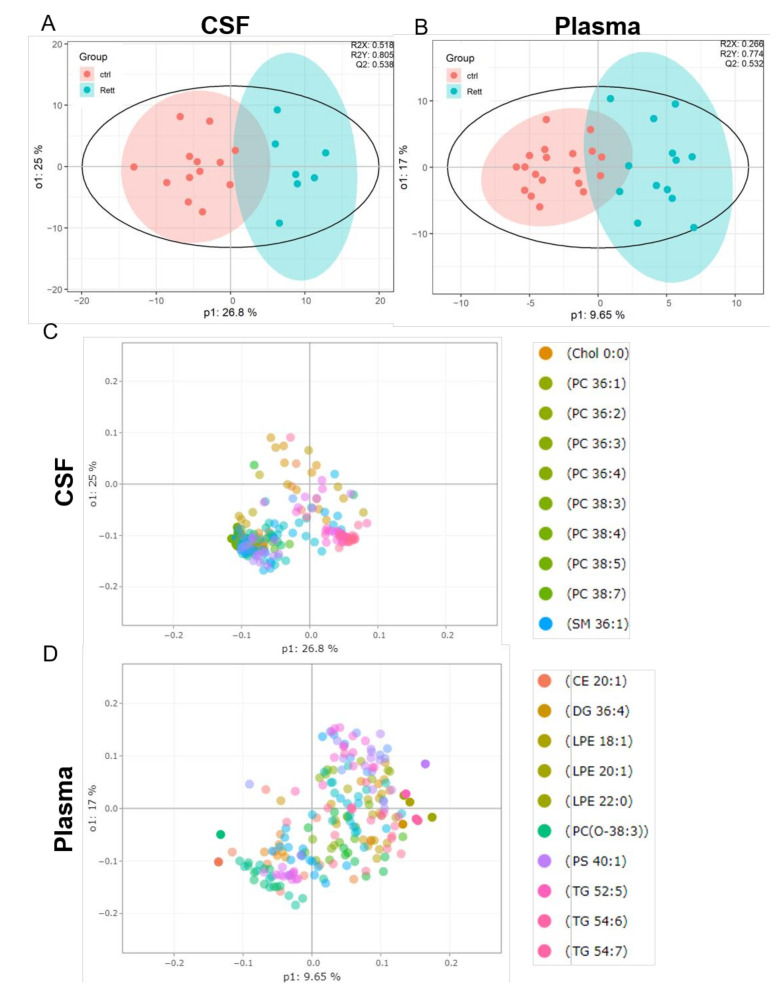
Figure 2.
Supervised multivariate statistical analysis of the CSF (A,C) and plasma (B,D). (A,B) Orthogonal partial least square-discriminant analysis (OPLS-DA) plots were generated using the lipidome data set obtained from UHPLC-MS/MS analysis and the program R with the lipidr package. (C,D) Loading plot of CSF (C) and plasma (D) samples obtained from RTT patients compared to healthy controls. Scattered dots represent various lipid species that were identified as influential variables in the discriminant analysis. The top 10 variables are listed in the right panel. CE (Cholesterol Ester), Chol (Cholesterol), DG (Diacylglycerol), PC (Phosphatidylcholine), LPE (Lyso-Phosphatidylethanolamine), PS (Phosphatidylserine), SM (Sphingomyelin), TG (Triacylglycerol).

