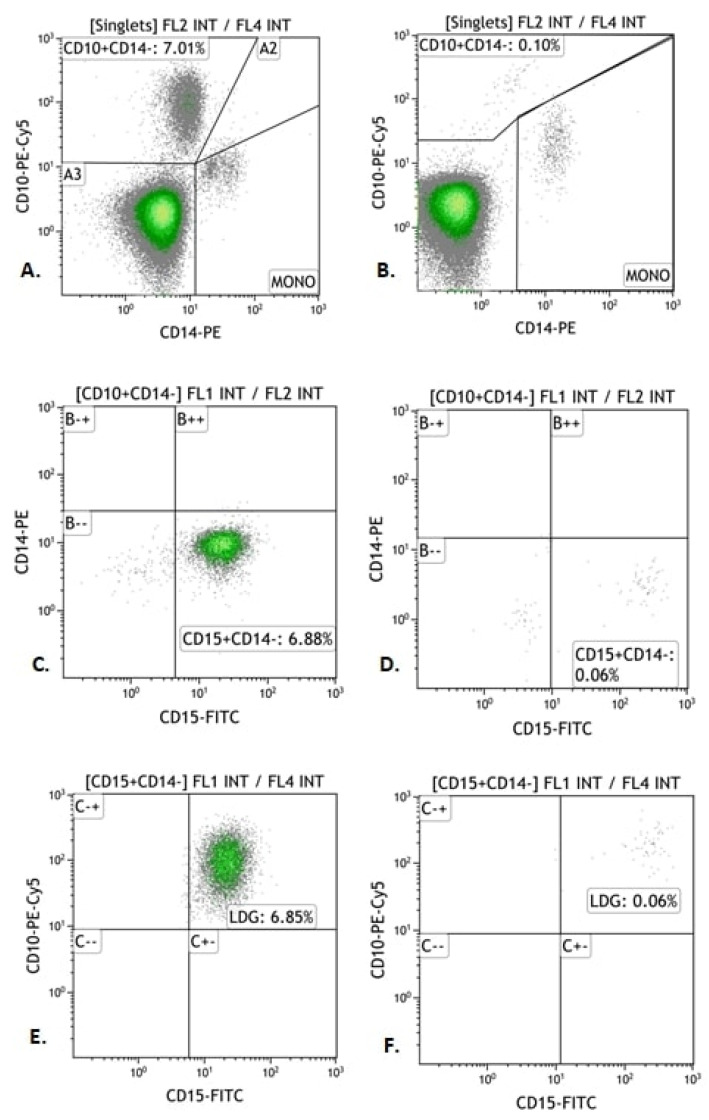
Figure 2.
Exemplary Immunophenotyping of LDG (CD10+ CD15+ CD14−) in patients with autoimmune hepatitis (AIH) and in the control group. (A,B) Cytograms. Percentage of cells positive for CD10 antigen and negative for CD14 (“CD10 Gate + CD14−”). (C,D) Cytograms. Percentage of LDG positive for CD15 antigen and negative for CD14 antigen (“CD15+ CD14− Gate”). (E,F) Cytograms. Percentage of LDG positive for CD15 and CD10 antigens and negative for CD14 (“LDG Gate”). (A,C,E) Cytograms—study group; (B,D,F) Cytograms—control group.

