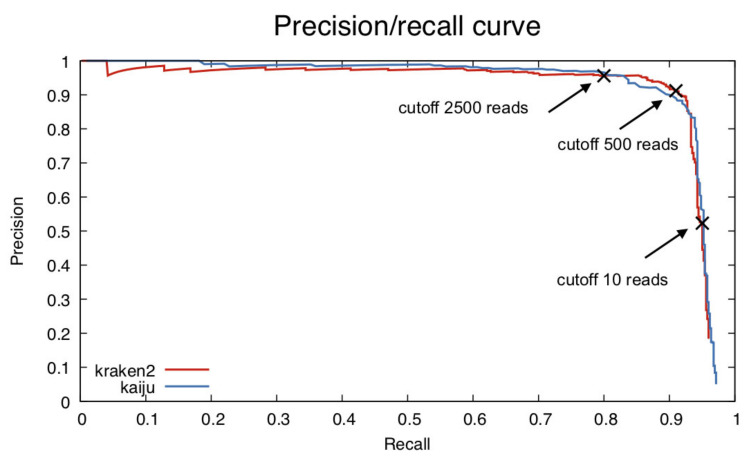
Figure 2.
Precision/recall curves for the classifiers Kraken 2 and Kaiju with the simBA525 dataset according to Ye et al. in 2019 [3]. Each point in the curves represents the precision and recall score for a specific read abundance threshold, calculated on a simulated dataset. We observed a sharp decrease in precision when the threshold was below 500 reads per species, indicating many false-positive species with low abundance. The figure also shows the cutoff values for recall of 0.8 and 0.95 at 2500 and 10 reads, respectively.

