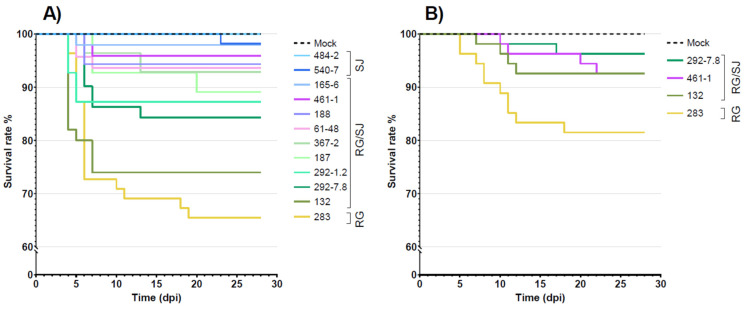
Figure 1.
Kaplan–Meier survival curves of the 12 isolates tested for their virulence in ESB. (A) Trial by intramuscular injection; (B) trial by bath immersion. The y-axis reports the survival rate; the x-axis reports the observation period expressed as days post infection (dpi). Step curves represent the survival rate of challenged fish in each experimental group.

