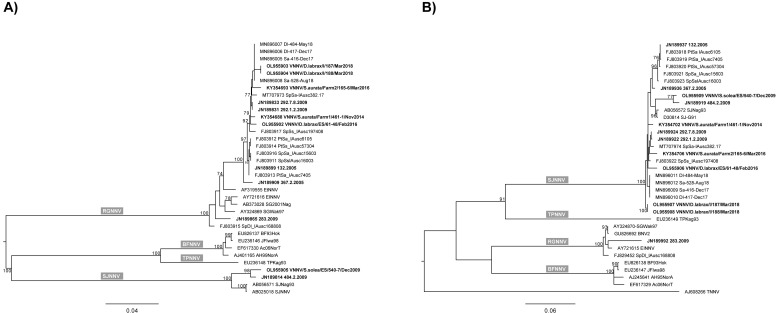
Figure 3.
ML phylogenetic trees of (A) RNA1 complete ORF and (B) RNA2 complete ORF. Isolates used for experimental infections are in bold and compared to betanodavirus representative sequences retrieved from GenBank. The numbers at branch points correspond to bootstrap values expressed as percentages (only values ≥70 are reported). The genotype subdivision according to Nishizawa et al. [10] is shown at the main branches. Scale bars represent nucleotide substitutions per site.

