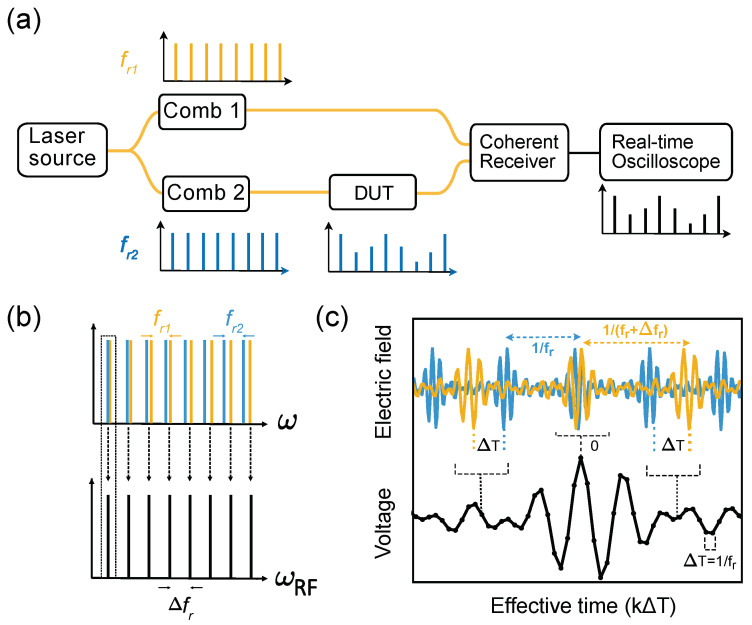
Figure 8.
Frequency domain description of DCI: (a,b) Two frequency combs with slightly different repetition rates, and , interact with each other and at least one comb passes through the DUT, whose frequency response changes the shape of the comb lines. The resulting absorption and phase on the comb teeth are modified into the corresponding amplitude and phase of the measured RF comb (green) with the repetition frequency . The RF spectrum can also be obtained by Fourier transforming a series of time domain interferograms. Time domain description of DCI: (c) Two pulse trains with slightly different repetition rates, and , beat each other in a photodetector. These two optical pulse trains interact and effectively ’walk through’ each other. The resulting photoreceiver signal below is a product of two comb pulses integrated over the receiver bandwidth and the signal can be viewed as an interferogram. This output is usually a function of the effective time, , where k is the sample number at time intervals of . The large central part of the received interferogram corresponds to the simultaneous arrival of the two pulses (when is 0). A weak ringing visible on the ’tails’ contains absorption information of the DUT.

