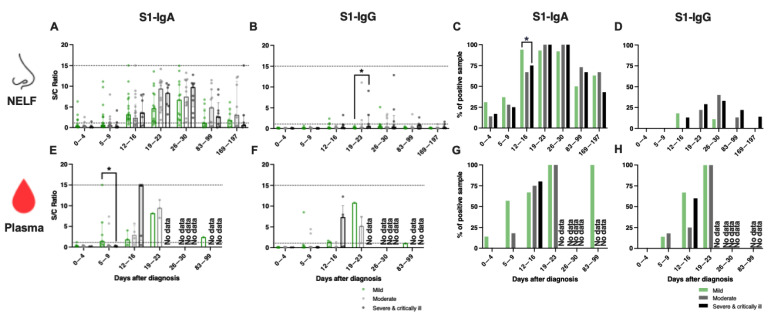
Figure 3.
SARS-CoV-2 S1-specific antibody levels in the (A–D) nasal epithelial lining fluid (NELF) and (E–H) plasma in adult COVID-19 patients of different disease severity groups, from acute infection to the convalescent phase. Green, grey and black symbols indicate data of mild, moderate, and severe and critically ill patients, respectively. Antibody-level data points above the dotted line (sample/calibrator (S/C) ratio ≥ 1.1) are considered as positive, while the dotted lines at y = 15 indicate the upper detection limit of the assay. Median and interquartile ranges are plotted, with dots representing individual values. The percentages denote IgA- and IgG-positivity at each time point. The levels of S1-specific Ig were compared among disease severity groups with the Kruskal–Wallis test, followed by Dunn’s multiple comparisons test, with the percentage of positive samples by Fisher’s exact test at each time point. The asterisks indicate the statistical differences found, *: p < 0.05. “No data” labels the corresponding time point as having no samples available.

