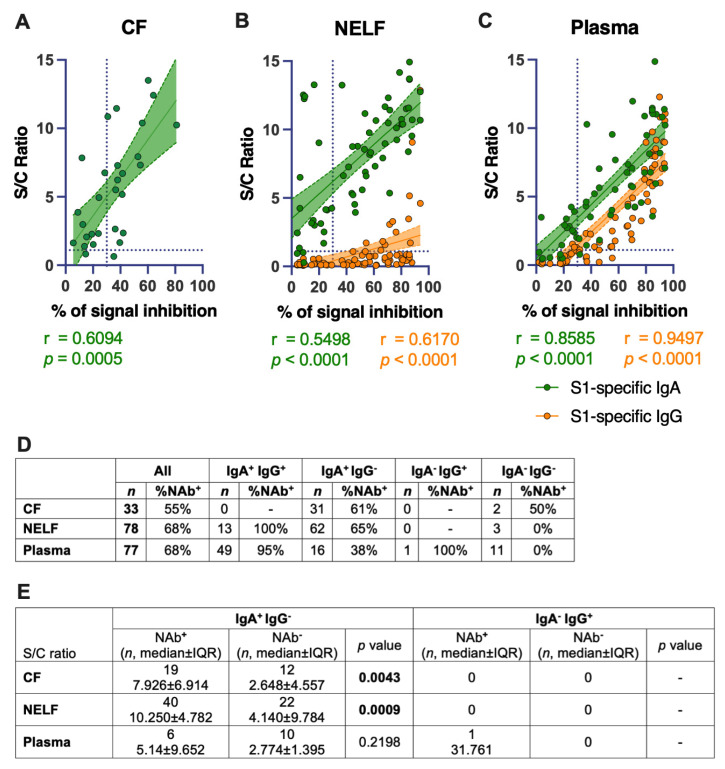
Figure 5.
Correlation of SARS-CoV-2 S1-specific Igs to the percentage of signal inhibition in the surrogate ACE-2-based neutralization readout. (A) The correlation coefficients of the conjunctival fluid, (B) NELF, and (C) plasma of COVID-19 patients are superimposed on the panel, with trend lines estimated with the use of simple linear regression. Plots show the S/C ratio of the IgA (green) and IgG (orange), plotted against the percentage of inhibition of the SARS-CoV-2 spike-ACE-2 binding signal, in which an inhibition of ≥ 30% is regarded as the threshold for a positive sample, indicated by the vertical dotted line. Green and orange dotted lines represent significant linear regression fits, with 95% confidence intervals (a shaded region with the corresponding colors). (D) The table shows the number of each sample type included (n) in the surrogate neutralization test and the overall percentage of the sample with a neutralization effect. The number of samples with specific immunological status (e.g., IgA+IgG+) and the corresponding percentage of that immunological status with a neutralizing effect (i.e., ≥30% inhibition) are shown. (E) Comparison of the IgA levels between neutralizing (NAb+) and non-neutralizing (Nab−) samples with the immunological status of IgA+IgG− was performed with a Mann–Whitney test.

