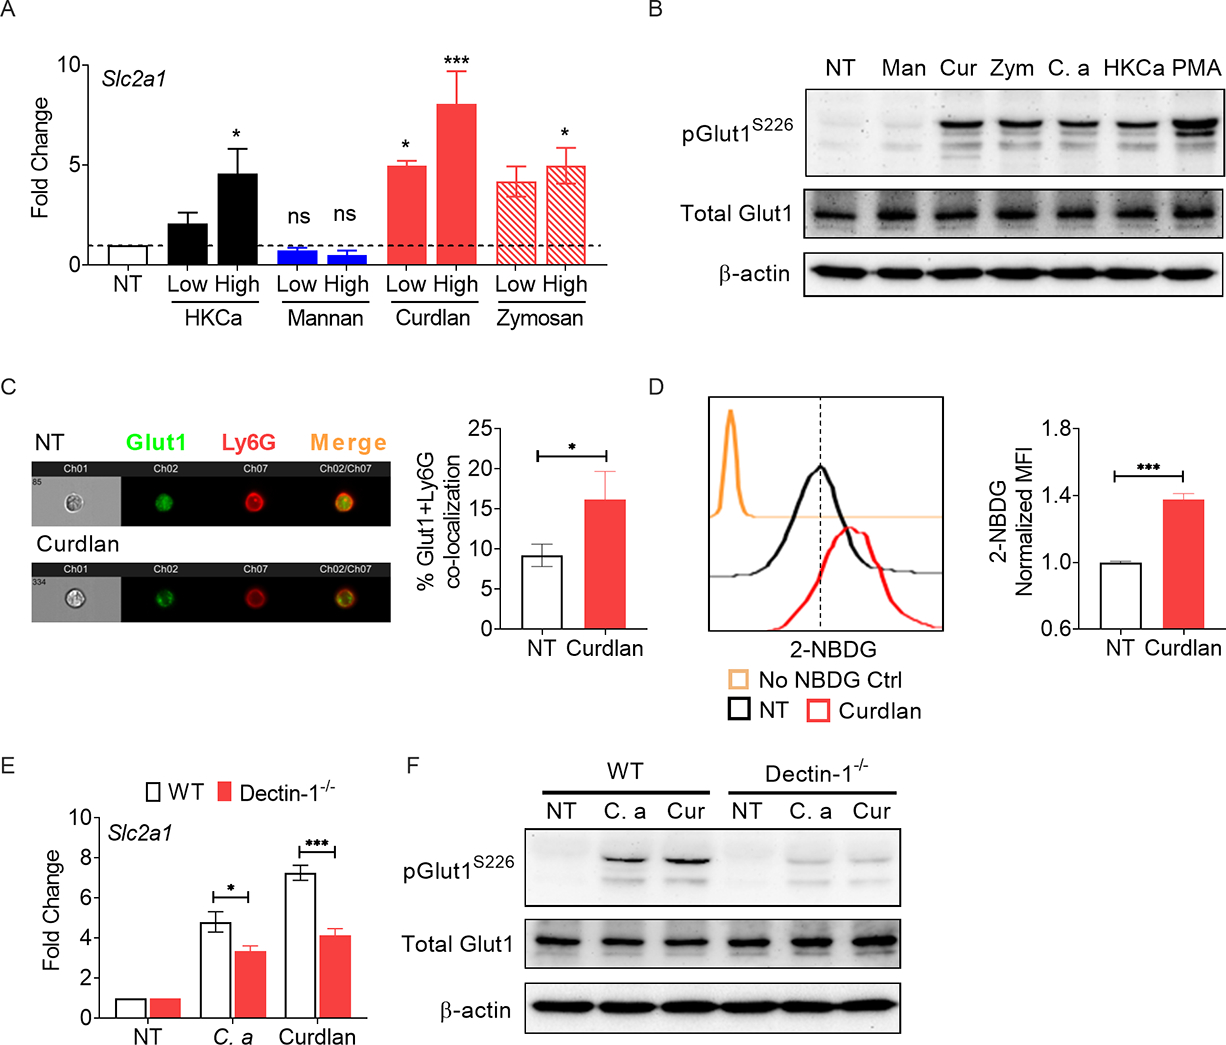
Fig 2: Fungal β-glucan and dectin-1 interaction controls Glut1 function in neutrophils.

(A) BM neutrophils from WT mice were stimulated with heat-killed C. albicans (C. a) [HKCa, MOI=1 (low) or 5 (high)], mannan [Man: 10 (low) or 100 μg/ml (high)], curdlan [Cur: (10 (low) or 100 μg/ml (high)], or zymosan [Zym: (10 (low) or 100 μg/ml (high)] for 3 h. Gene expression of Slc2a1 was measured by qPCR. (B) Neutrophils were stimulated with C. a (MOI=1), HKCa (MOI=1), mannan (100 μg/ml), curdlan (100 μg/ml) or zymosan (100 μg/ml) for 30 min and Glut1 phosphorylation was assessed by western blot. Neutrophils were stimulated with curdlan (100 μg/ml) for 1.5 h. (C) Localization of Glut1 in neutrophils was visualized by ImageStream analysis and (D) glucose uptake (2-NBDG+ cells) was detected by flow cytometry. (E) Neutrophils from WT or Dectin-1−/− mice were stimulated with C. albicans (MOI=0.2) or curdlan (10 μg/ml) for 3 h. Gene expression of Slc2a1 was measured by qPCR. (F) Neutrophils from WT or Dectin-1−/− mice were stimulated with C. a (MOI=1) or curdlan (100 μg/ml). Phosphorylation of Glut1 was assessed by western blot at 30 min post-stimulation. Data pooled from at least 3 independent experiments (A-F) and representative images and histogram plots are shown. Statistical analysis by One-way ANOVA (A), Student’s T test (C, D) and Two-way ANOVA (E). Data are represented as mean ± SEM (A, C, D, E). See also Fig S1.
