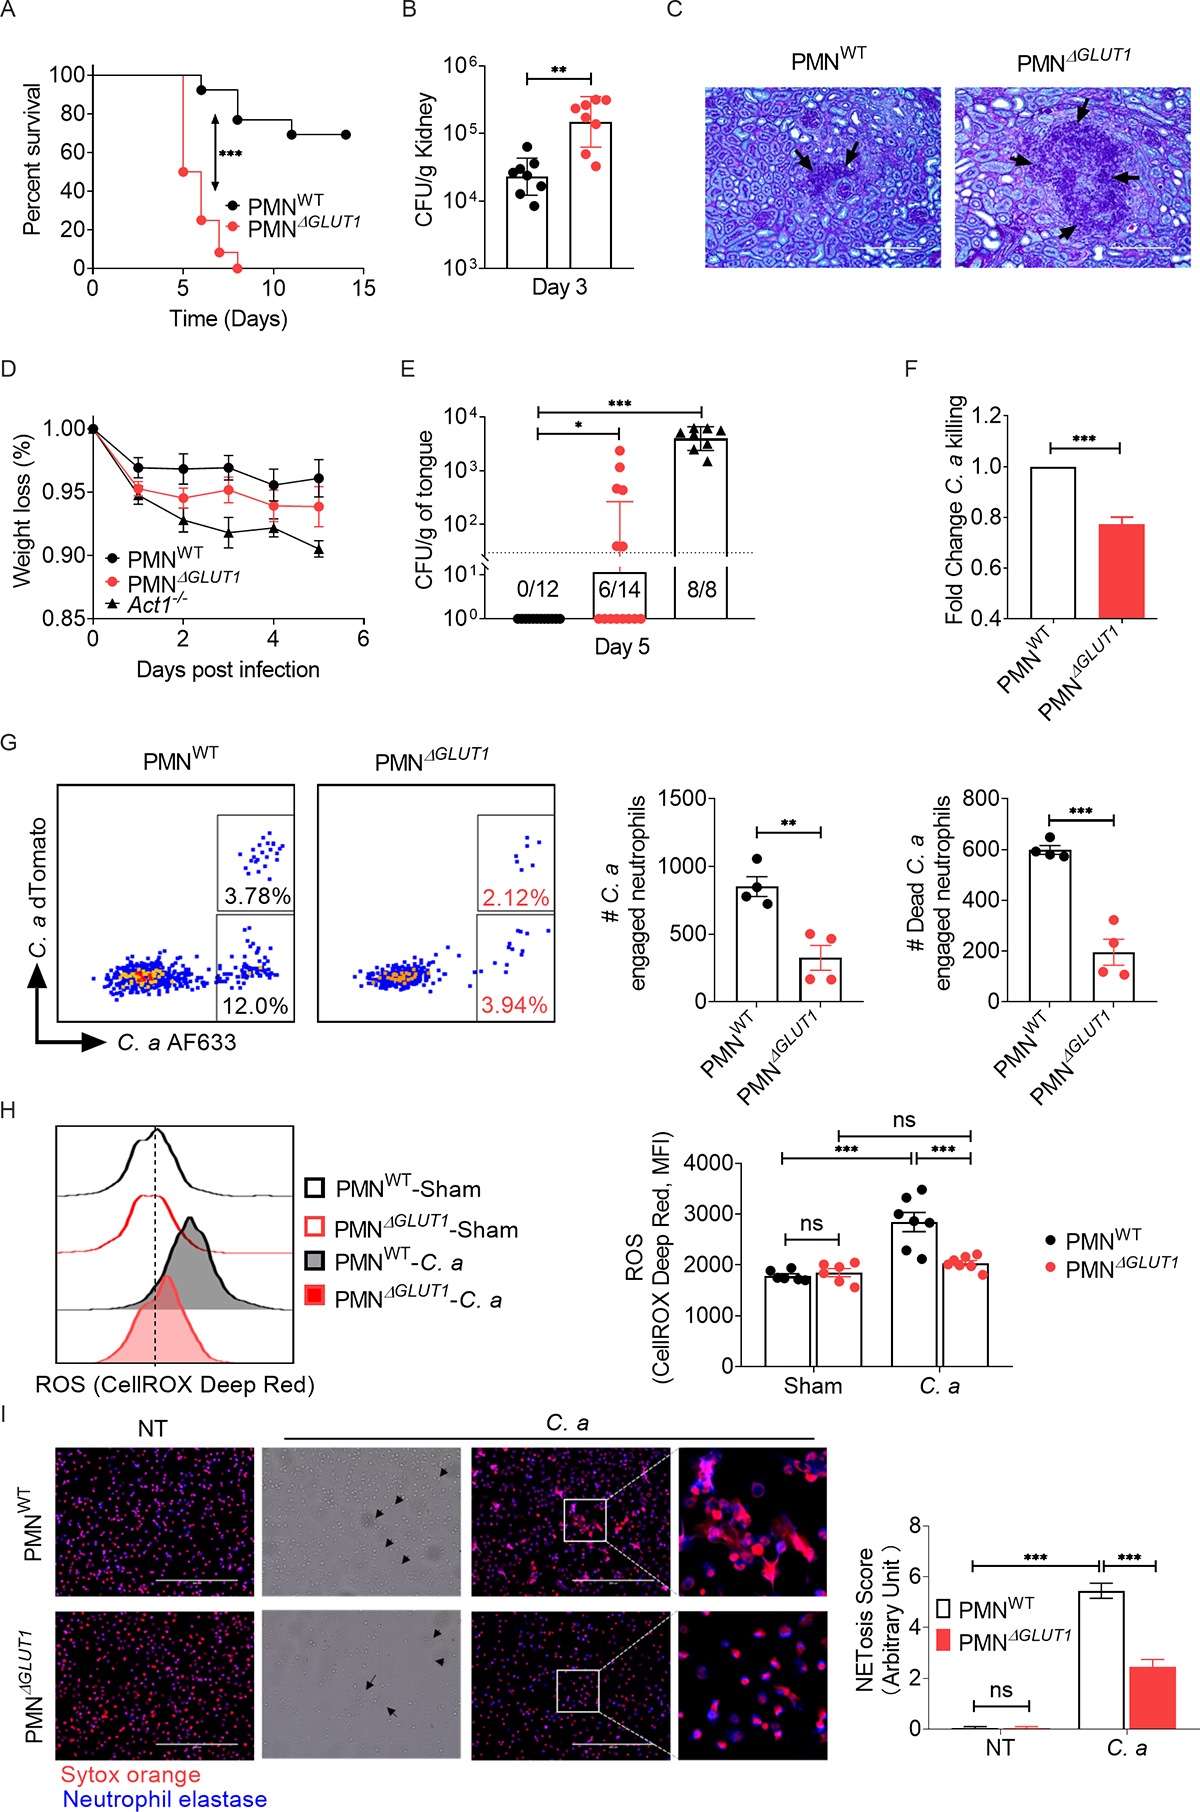
Fig 6: Deficiency of Glut1 in neutrophils exacerbates susceptibility of mice to disseminated candidiasis.

PMNWT and PMNΔGLUT1 mice were infected with C. albicans (C. a). (A) Mice were evaluated for survival over a period of 14 days (n=12). (B) Kidney fungal burden (n=8) and (C) renal histopathology (PAS staining) was evaluated at day 3 p.i. Black arrows indicate C. a hyphae in renal parenchyma. Magnification: 20×10. PMNWT and PMNΔGLUT1 mice were sublingually inoculated with a cotton ball saturated in C. a for 75 min (n=8–14). (D) Mice body weight were monitored daily and (E) fungal burden of the tongue was evaluated at day 5 p.i. (F) BM neutrophils from PMNWT or PMNΔGLUT1 mice were incubated with C. a (MOI=0.2) for 3 h. Candidacidal capacity was assessed by in vitro fungal killing assay. (G) PMNWT and PMNΔGLUT1 mice were infected with 5 × 10⁶ CFU of Streptavidin-AF633+dTomato+ C. a. Mice were sacrificed 2 h p.i. and phagocytosis and intracellular killing by kidney-infiltrating neutrophils were measured by flow cytometry analysis. Live C. a engaged neutrophils emit two fluorescence signals (dTomato+AF633+) while dead C. a engaged neutrophils just emit only AF633 fluorescence signal (dTomato−AF633+). (H) Mice were infected with C. a for 24 h. ROS production in kidney infiltrating neutrophils were measured by CellROX® Deep Red reagent. (I) Neutrophils were incubated with C. a (MOI=0.2) for 3 h and NET formation was visualized by staining with Sytox Orange and anti-neutrophil elastase antibody. Black triangles indicate fungal hyphae. Magnification: 40×10. Frequency of NETosis score was blindly evaluated and expressed as arbitrary units. Data pooled from at least 2–3 independent experiments (A-I) and representative images and FACS plots are shown. Statistical analysis by log-rank test (A), Mann-Whitney test (B, E), Student’s T test (F, G) or Two-way ANOVA (H, I). Data are represented as geometric mean with geometric SD (B, E) or mean ± SEM (D, F, G, H, I). See also Fig S6, S7.
