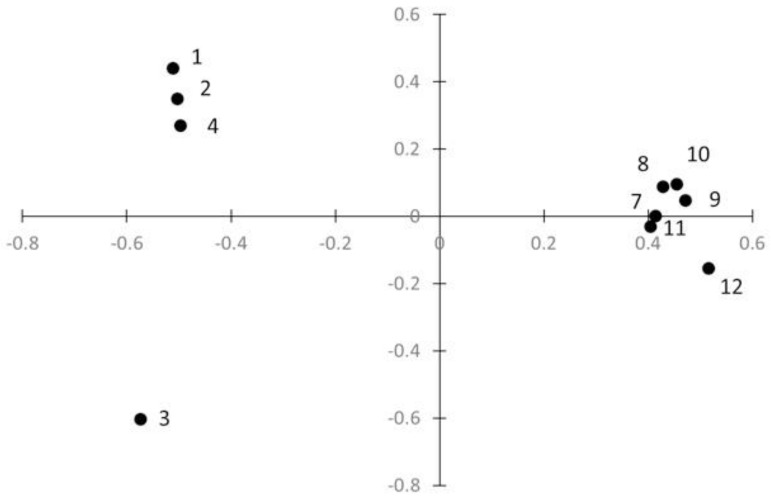
Figure 1.
Population genetic structure graph assessed by principal component analysis of 1136 S. haematobium parasites collected in Nigeria revealed by graph (PCA). Each sampling site is represented by a dot. The first and second axis of the PCA represent 43.8% and 22.9%, respectively, of the total variation in allele frequency.

