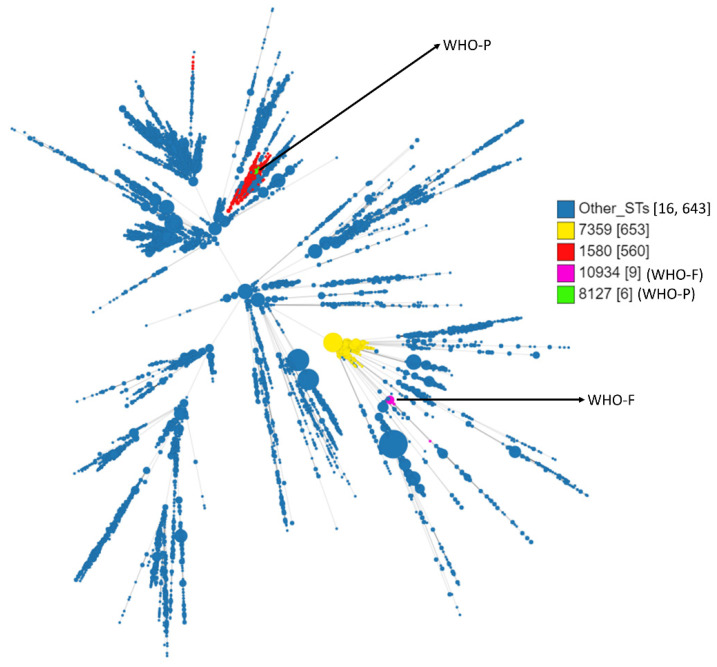
Figure 1.
Minimum spanning tree comparing core-genome allelic profiles with MLST resulting in isolates with similar allelic profiles forming clusters. Isolates are displayed as circles. The size of each circle indicates the number of isolates of this particular type. Numbers in brackets refer to the number of isolates. WHO-F (ST10934) is denoted in magenta colour and WHO-P (ST8127) in green color.

