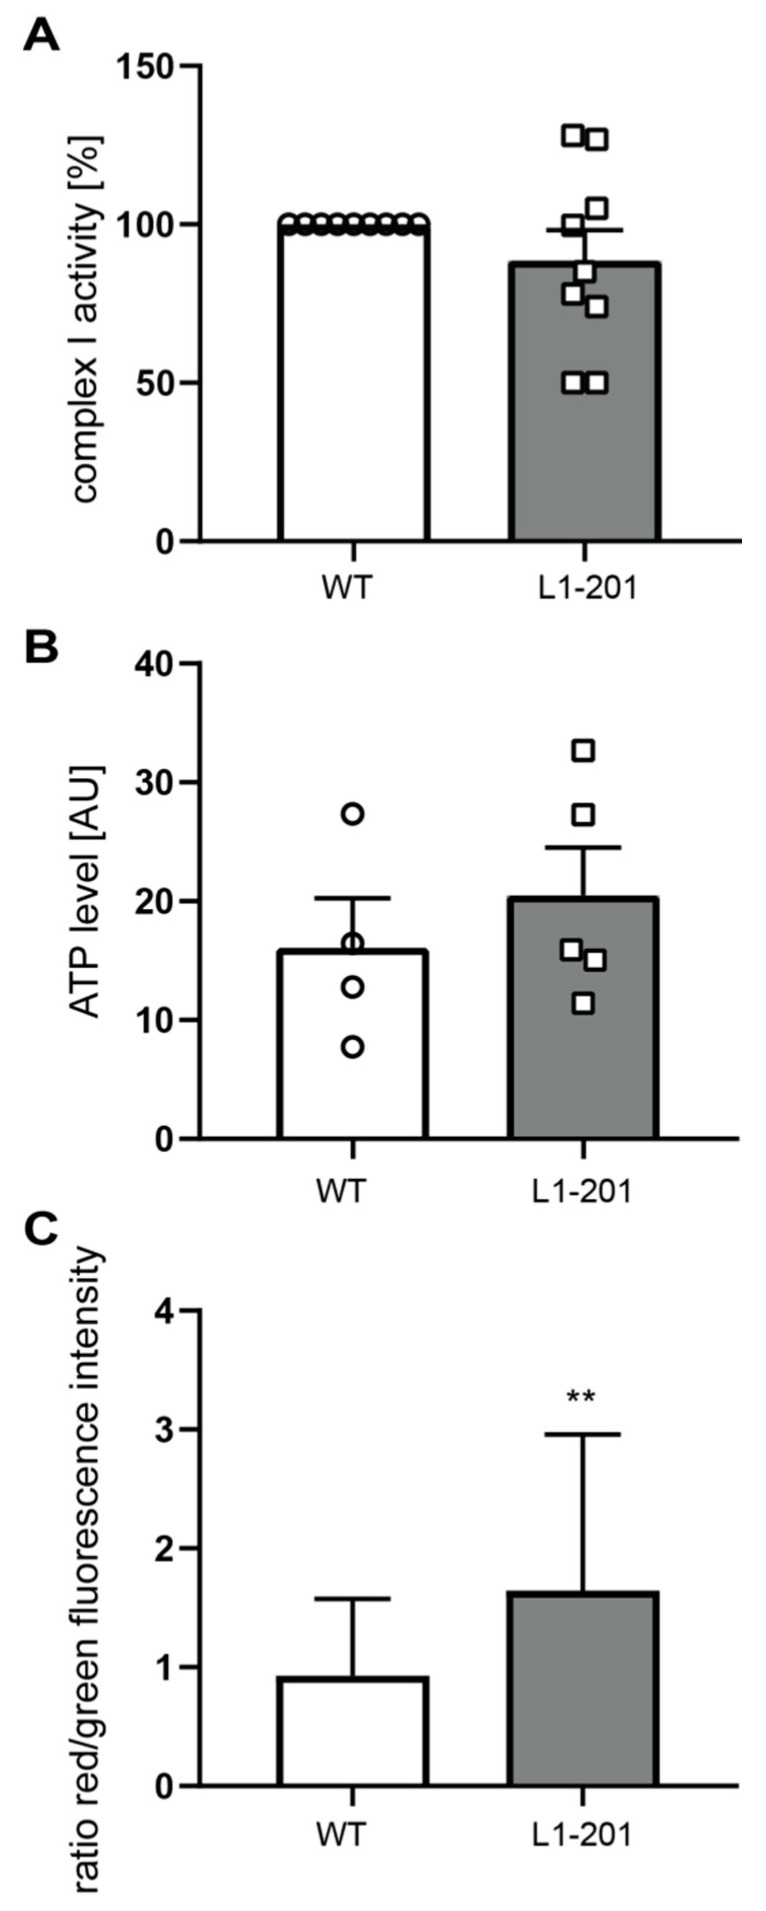
Figure 6.
Normal Complex I activity, normal ATP levels and higher membrane potential in mitochondria from L1-201 mice. (A) Mitochondrial Complex I activity was determined using isolated mitochondria from whole brains of 7- to 9-day-old male L1-201 (gray bars) and wild-type (WT, white bars) littermate mice (n = 9 mice per group). (B,C) Mitochondrial ATP levels (B) and mitochondrial membrane potential (C) were determined in cultured cerebellar neurons from 7-day-old male L1-201 (gray bars) and wild-type (WT, white bars) littermate mice (n = 4 mice per group). Means ± SEM and values from individual mice are shown for Complex I activity and ATP levels (A,B) and means ± SD for membrane potential (C); n = 3. ** p < 0.01 (membrane potential: Student´s t-test; Complex I activity and ATP levels: Mann–Whitney test).

