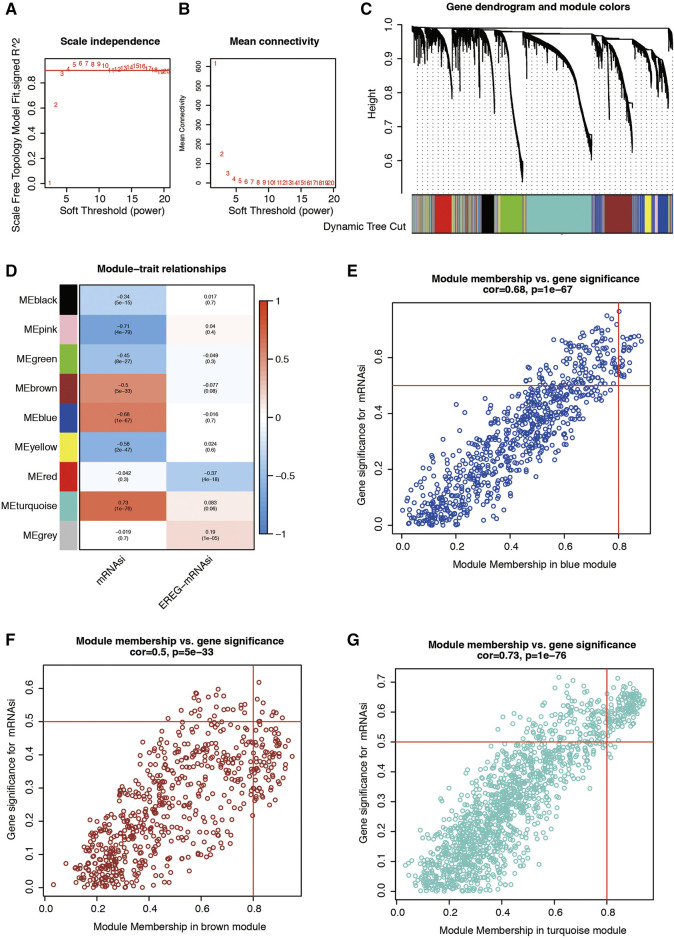
FIGURE 2.
(A,B) Graphs of scale independence, mean connectivity and scale-free topology, the appropriate soft-power was 4. (C) Cluster dendrogram of the co-expression network modules (1-TOM). (D) Correlation between the gene module and clinical characteristics, including the mRNAsi and EREG-mRNAsi. (E) Scatter diagram for MM vs. GS for the mRNAsi in the blue module. (F) Scatter diagram for MM vs. GS for the mRNAsi in the brown module. (G) Scatter diagram for MM vs. GS for the mRNAsi in the turquoise module. LUAD, lung adenocarcinoma; mRNAsi, mRNA expression-based stemness index; EREG, epigenetically regulated.

