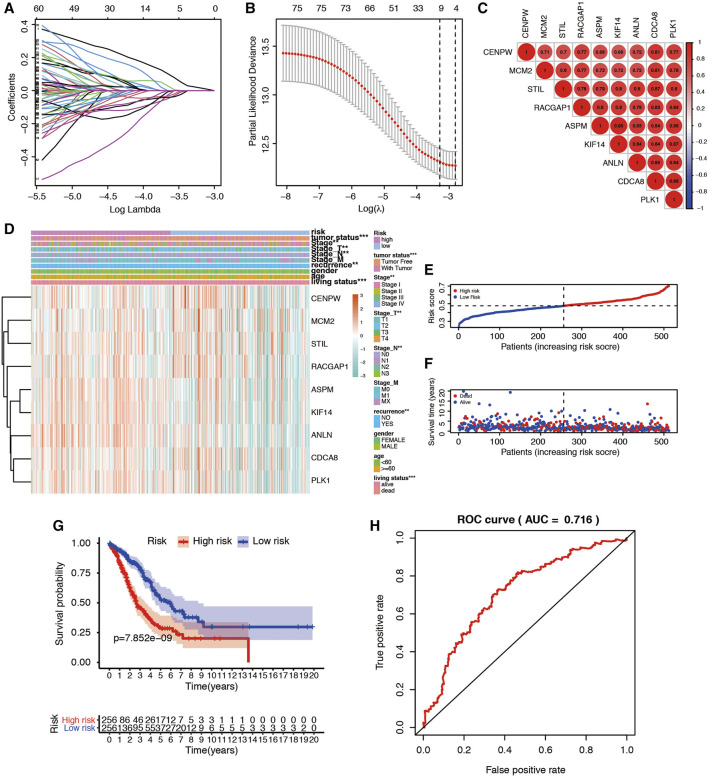
FIGURE 6.
Construction and validation of mRNAsi-related signature for LUAD patients. (A) Lasso regression identified the prognostic model in LUAD. (B) Cross-validation to select the optimal tuning parameter (λ). The red dotted vertical line crosses over the optimal log λ. (C) The relationship among nine key genes. The bigger the circle size, the more correlative two genes are. (D) The heatmap shows the expression of the 9 genes in high-risk and low-risk LUAD patients. The distribution of clinicopathological characteristics was compared between the high-risk and low-risk groups. *p < 0.05, **p < 0.01 and ***p < 0.001. (E) Risk score distribution of patients in the prognostic model. (F) Survival status scatter plots for patients in the prognostic model. (G) Kaplan-Meier curve analysis of the high-risk and low-risk groups. (H) Time-dependent ROC curve analysis of the prognostic model.

