Figure 2.
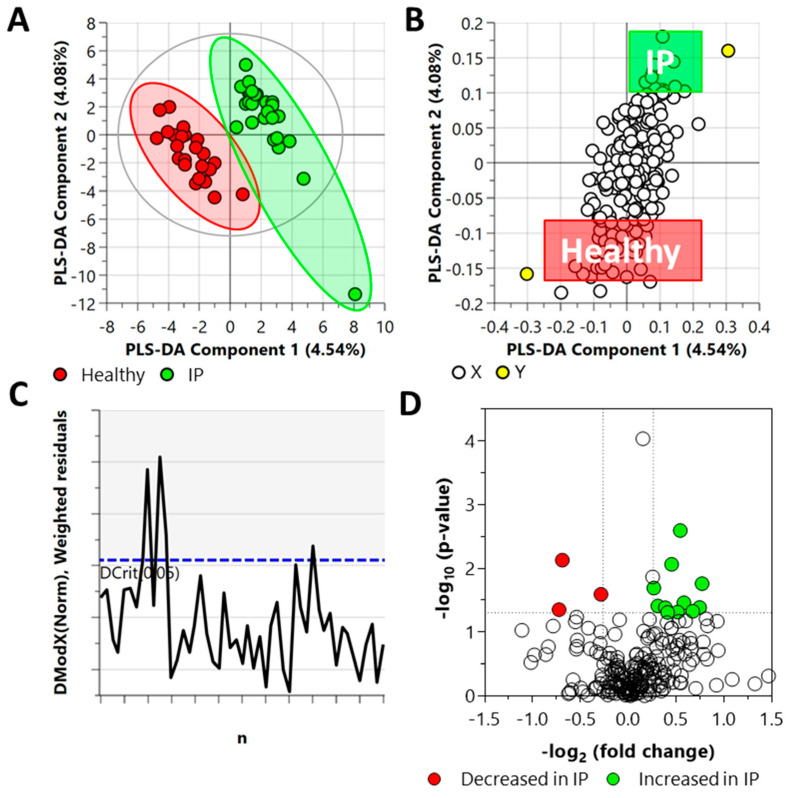
Distinct metabolic profiles of plasma samples in increased IP subjects compared with the healthy subjects, as revealed by the Partial Least Square Discriminant Analysis (PLS-DA) (panels A–C) and fold change (FC) analysis (panel D). (A) PLS-DA scatter plot, (B) PLS-DA loading plot, (C) distance of observation plot, and (D) volcano plot of plasma samples collected from study participants. R2X (cum) = 0.0862, R2Y (cum) = 0.947, Q2 = 0.372, DCrit (blue line in panel C) = 1.222. Note: The ellipse presented in panel A represents Hotelling’s T2 confidence limit (95%). The colored circles in panel A represent each analyzed sample, while the yellow-colored circles in panel B indicate the average group position for each sample cluster, with the white circles representing the distribution of metabolite features between these groups. The colored circles in panel D represent significant metabolites in IP subjects compared with the healthy subjects.

