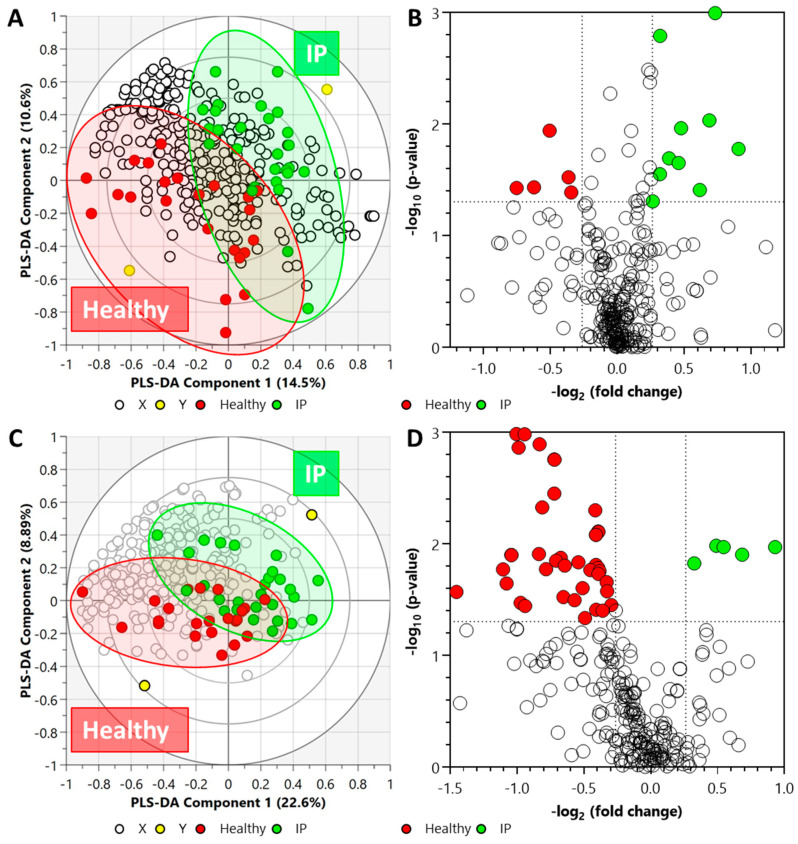
Figure 3.
Biplot overview (panels A,C) of LC-QToF MS acquired data set and associated global view (panels B,D) of the significant compounds. (Panels A,B) metabolite data set from plasma samples (R2X = 0.358, R2Y = 0.934, Q2 = 0.355), and (panels C,D) lipid data set from plasma samples (R2X = 0.572, R2Y = 0.833, and Q2 = 0.0746). Note: In panels (A,C), the ellipses on the biplots represent the 100%, 75%, and 50% correlation coefficient for measured metabolites. The colored circles represent each analyzed sample, while the yellow-colored circles indicate the averaged group position for each sample cluster, and the white circles represent the distribution of LC-QToF MS detected metabolites between increased intestinal permeability (IP) and healthy groups. The colored circles in panel (D) represent significant metabolites in IP subjects compared with the healthy subjects.

