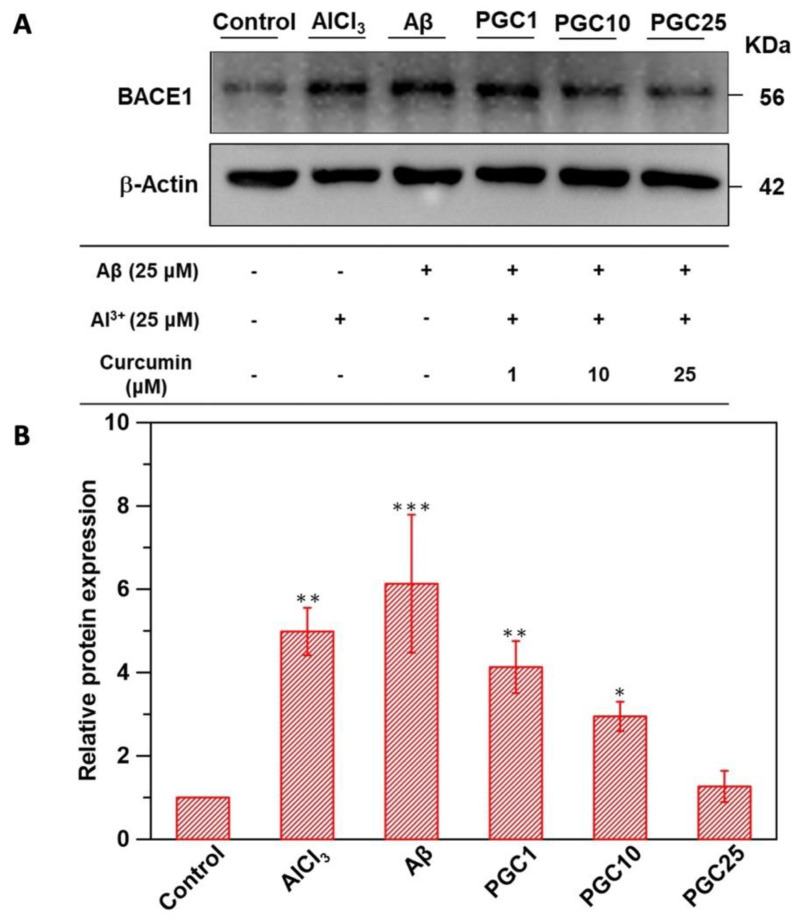
Figure 5.
Biochemical analysis. (A) The western blot analysis of BACE1. β-actin was used as the loading control. (B) The quantitative values of the BACE1 expression data obtained the ratio of BACE1 protein/actin protein band intensities normalized to 1 in the control group (n = 6, * p < 0.05 compared with control, ** p < 0.01 compared with control, *** p < 0.001 compared with control).

