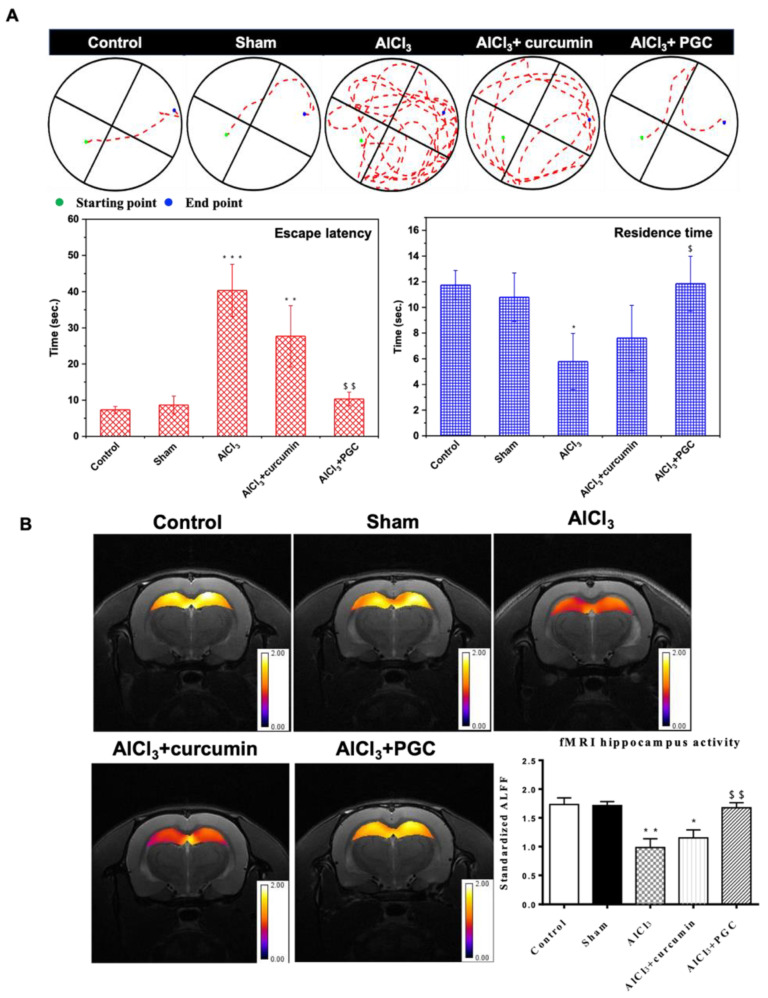
Figure 7.
The Morris WM test and determination of hippocampal activity by fMRI. (A) The MWM track of the normal rats (control), PBS injection (Sham), AlCl3-induced AD rats (AlCl3), curcumin-free drug- treated AD rats (AlCl3 + curcumin), and PGC treatment (AlCl3 + PGC). The starting point (blue) to endpoint (green) of all the tested rats was the same (n = 6, * p < 0.05 compared with control, ** p < 0.01 compared with control, *** p < 0.001 compared with control, $ p < 0.05 compared with AlCl3 group, $$ p < 0.01 compared with AlCl3 group). (B) fMRI analysis of brain activity on rats’ hippocampus. The statistical parametric mapping of the brain activity in the rat hippocampus. The brain activity was determined by the intensity of brightness in the ROI on single shot GRE-EPI images. The intensity of brightness in the ROI of the AlCl3 group was about 50% lower than that of the control and AlCl3 + PGC group (n = 6, * p < 0.05 compared with control, ** p < 0.01 compared with control compared with control, $$ p < 0.01 compared with AlCl3 group).

