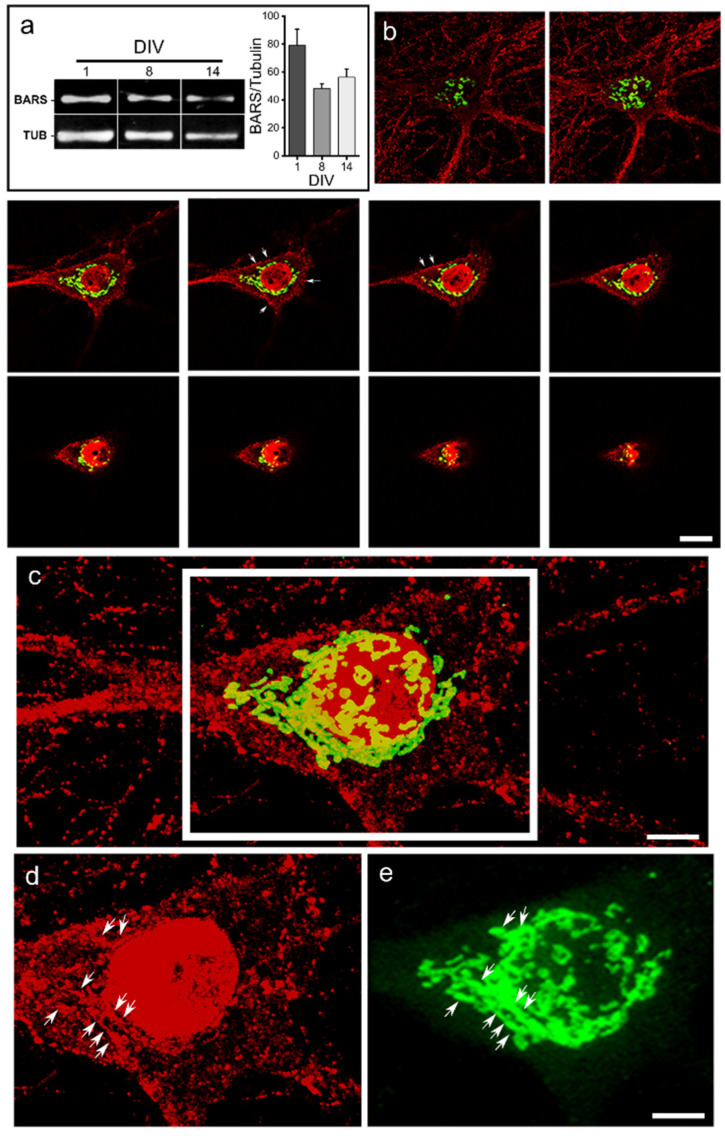
Figure 1.
Expression and distribution of BARS in cultured neurons. (a) Western blots (left panel) and quantification (right panel) showing the presence of BARS in cell extracts obtained from cultured hippocampal neurons after development for 1, 8, and 14 DIV (days in vitro). TUB: α-tubulin. Graphs represent mean ± S.E.M. of BARS densitometry data normalized to α-tubulin. One-way ANOVA test. Three independent cultures per group were analyzed. (b) A z-series of confocal images from a 14 DIV cultured hippocampal neuron showing the distribution of BARS (red) and GM130 (green). Note that BARS immunofluorescence localizes to the cell nucleus, the cell soma, and neurites (punctate labeling); labeling is also observed in close proximity to the plasma membrane (arrows) and the Golgi region. Scale bar: 5 µm. (c) A maximal projection image collected from the images shown in (b). (d,e) Single channel of the insert in (c) showing the distribution of endogenous BARS (d, red) and the Golgi marker GM130 (e, green). Note that BARS immunolabeling partially colocalizes with GM130 + profiles (arrows). Scale bar: 2.5 µm.

