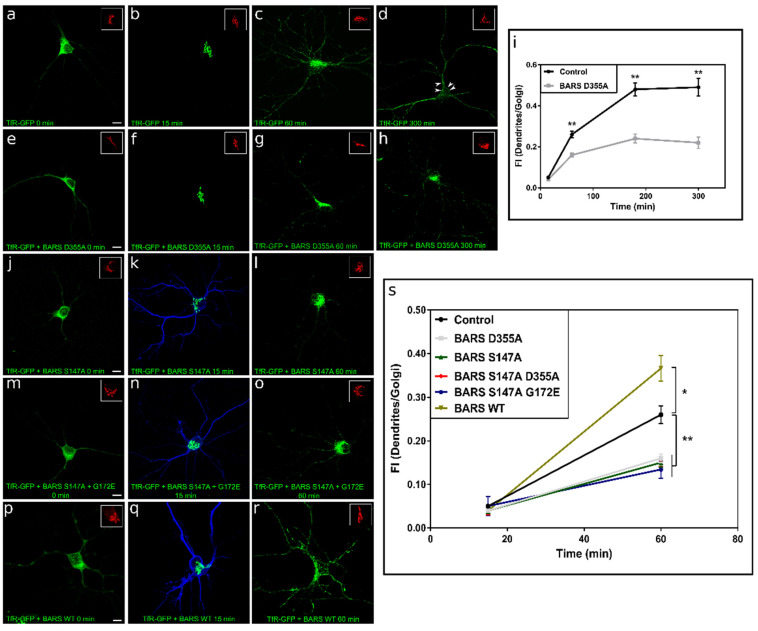
Figure 4.
BARS regulates trafficking of TfR. (a–h) A series of confocal images showing the distribution of ectopically-expressed TfR-GFP-FM4 alone or after co-transfection with BARS D355A. The distribution of TfR-GFP-FM4 is indicated at different time points after the addition of DD solubilizer. Inset, distribution of the Golgi apparatus marker TGN38 (red). In control cells (GFP-transfected) most of the TfR-GFP labeling disappeared from the Golgi region 300 min after the addition of DD (d); the arrowheads in (d) indicate the presence of the labeling close to the dendritic plasma membrane. By contrast, in neurons co-expressing the BARS fission-defective mutant most of the labeling remains in the Golgi area (h). Scale bar: 10 µm. (i) Graphs showing the fluorescent intensity (FI) ratio between TfR-GFP labeling in dendrites and the Golgi area at 15, 60, 180, and 300 min after the addition of DD solubilizer in control and in neurons expressing BARS D355A mutant. (j–o) A series of confocal images showing the distribution of ectopically-expressed TfR-GFP-FM4 after co-transfection with BARS S147A (blue in k) or BARS S147A G172E (blue in n). The distribution of TfR-GFP-FM4 is indicated at different time points after the addition of DD solubilizer. Inset, distribution of the Golgi apparatus marker TGN38 (red). Scale bar: 10 µm. (p–r) A series of confocal images showing the distribution of ectopically-expressed TfR-GFP-FM4 after co-transfection with BARS WT (blue in (q)). The distribution of TfR-GFP-FM4 is indicated at different time points after the addition of DD solubilizer. Inset, distribution of the Golgi apparatus marker TGN38 (red). Scale bar: 10 µm. (s) Graphs showing the fluorescent intensity (FI) ratio between TfR-GFP labeling in dendrites and the Golgi area at 15 and 60 min after the addition of DD solubilizer in control and in neurons co-expressing BARS WT or different mutants. For all experiments 9 to 15 neurons were quantified pooled from at least three independent cultures. Graphs represent mean ± S.E.M.; * p < 0.05, ** p < 0.01; one-way ANOVA and Tukey’s post hoc test.

