Figure 5.
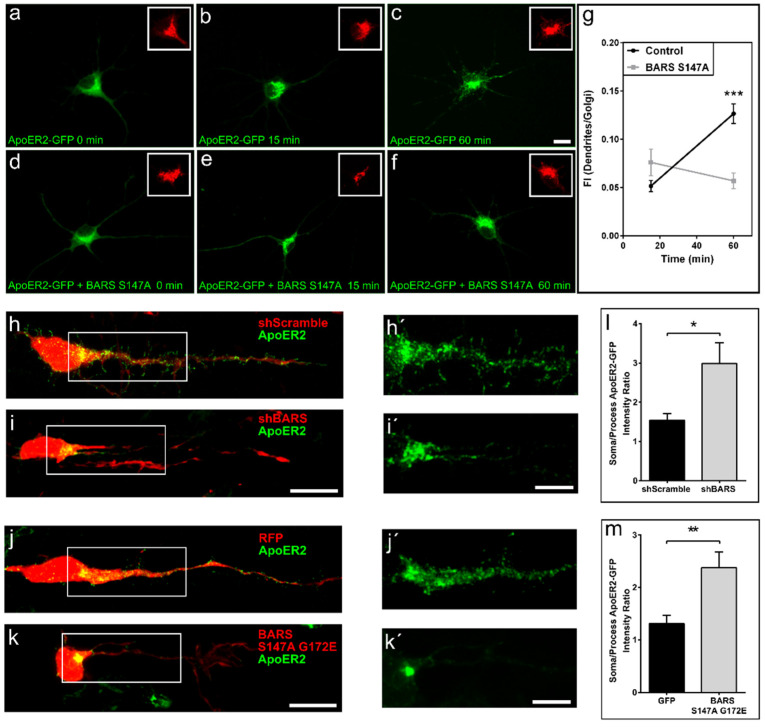
BARS regulates trafficking of ApoER2. (a–f) A series of confocal images showing the distribution of ectopically-expressed FM4-ApoER2-GFP alone or after co-transfection with BARS S174A and visualized 0, 15 and 60 min after the addition of DD solubilizer. Inset, distribution of the Golgi apparatus marker TGN38. Scale bar: 10 µm. (g) Graph showing the fluorescent intensity (FI) ratio between ApoER2-GFP labeling in dendrites and the Golgi area 15 and 60 min after the addition of DD solubilizer in control- and BARS S147A-expressing neurons. For all experiments, 9 neurons were quantified pooled from at least three independent cultures. Graphs represent mean ± S.E.M.; *** p < 0.001, Student’s t-test. (h) A confocal image showing the distribution of ApoER2 in a cortical neuron of mouse brain (embryonic day E18.5) transfected by IUE with sc-shRNA BARS-HcRED (scScramble,) plus ApoER2-GFP; note that the green labeling localized to a discrete area in the cell body and within the apical oriented neurite (image rotated 90º clockwise with respect to the ventral zone–cortical plate axis). (i) Idem as in (h), but from a mouse brain (embryonic day E18.5) electroporated with sh-RNA-BARS-HcRED (shBARS). (h’,i’) High magnification views of the inserts shown in (h,i). Scale bar: 5 µm. (j) A confocal image showing the distribution of ApoER2-GFP in a cell from a brain co-electroporated with RFP. (k) Idem as in (j), but from a brain electroporated with ApoER2 plus BARS S147A G172E. Scale bar: 10 µm. (j’,k’) High magnification views of the inserts shown in (j,k). Scale bar: 5 µm. (l) Graph showing the fluorescent intensity (FI) ratio between ApoER2-GFP labeling in the soma and the apical oriented neurite in cortical neurons after IUE of shScramble or shBARS. (m) Graph showing the fluorescent intensity (FI) ratio between ApoER2-GFP labeling in the soma and the apical oriented neurite in cortical neurons after IUE of RFP or RFP plus BARS S147A G172E. For all experiments 13 to 20 neurons were analyzed from 3 independent IUE for each experimental condition. Graphs represent mean ± S.E.M.; * p < 0.05, ** p < 0.01, Student’s t-test.

