Figure 3.
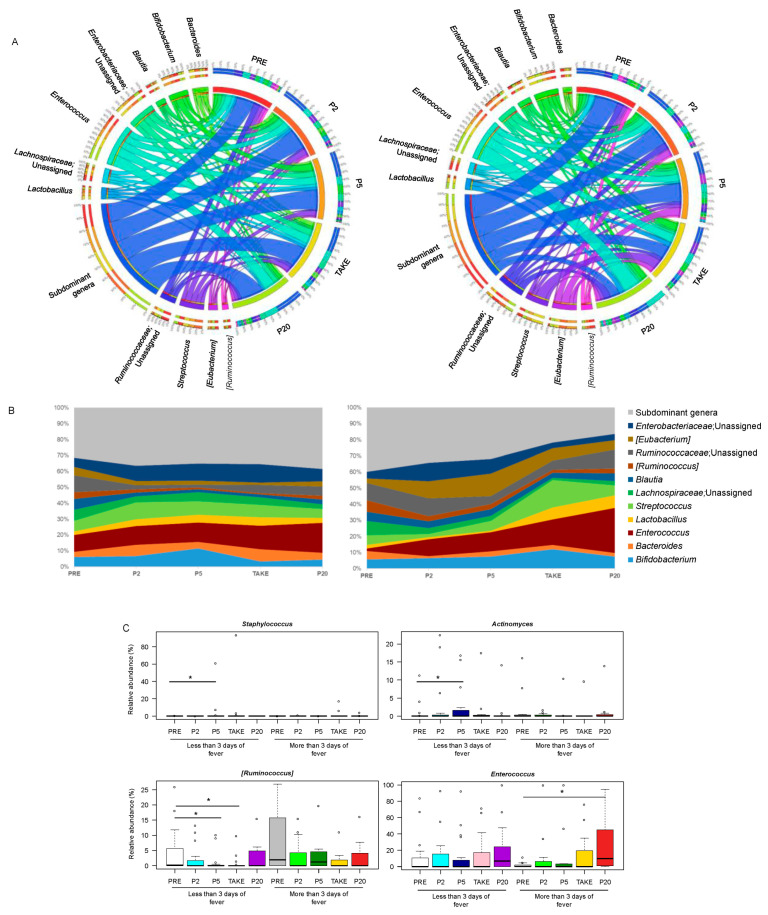
Genus-level gut microbiota trajectory in pediatric allo-HSCT patients with different duration of febrile neutropenia. Circos (A) and area (B) plots showing the relative abundance over time of the major genera in the GM of patients with less than or equal to (left) vs. more (right) than three days of fever. Only taxa with mean relative abundance > 20% in at least five samples of the total dataset are shown. PRE, before transplant; P2, at the onset of neutropenia (day −2/+2); P5, at the onset of fever (day +4/+5); TAKE, at engraftment; P20, after engraftment (day +20/+30); (C) Boxplots showing the relative abundance distribution of genera significantly differentially represented over time in patients with different duration of fever. Wilcoxon test, * for p < 0.05.

