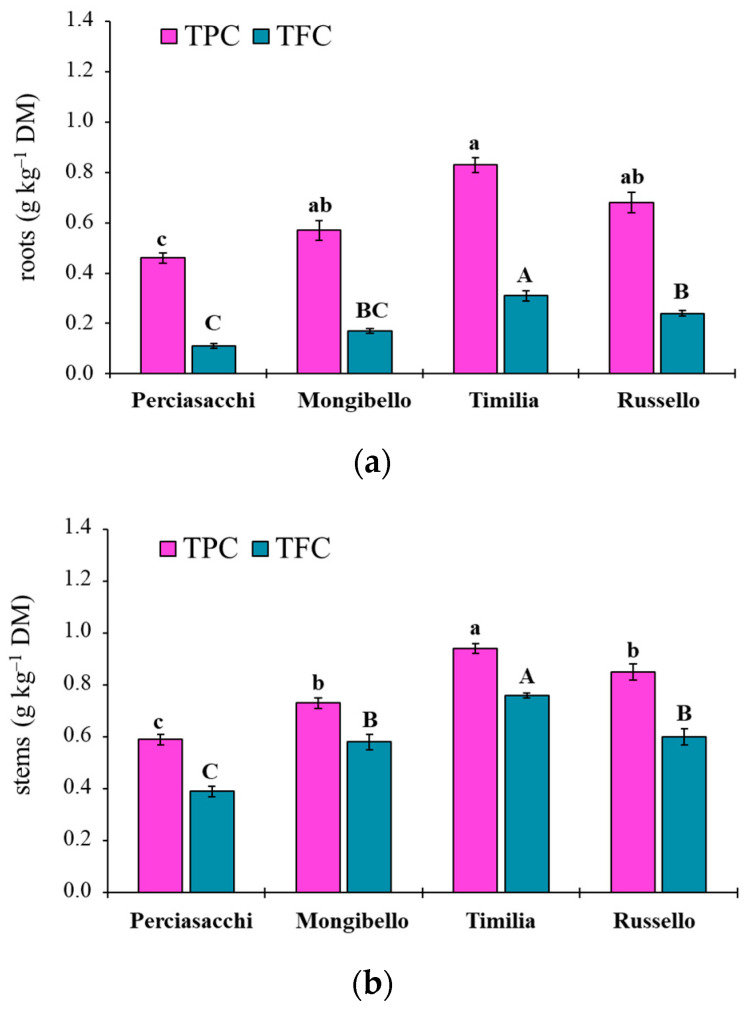
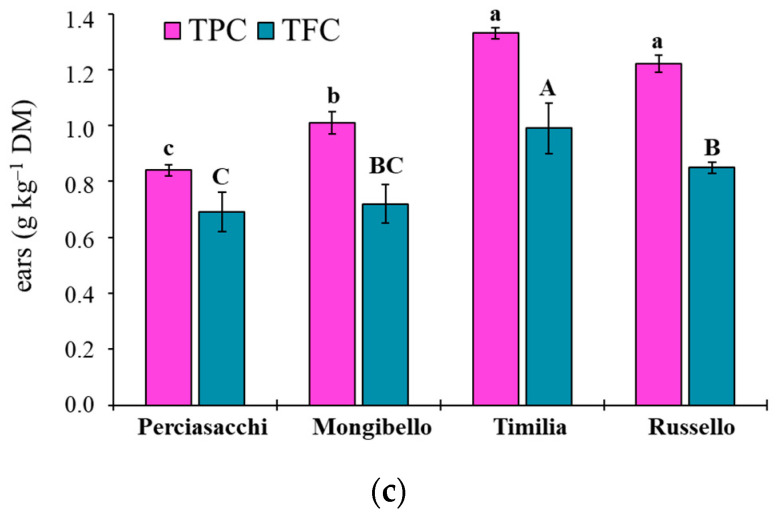
Figure 6.
Total polyphenol (TPC) and total flavonoid (TFC) content in root (a), stem (b) and ear (c) extracts of durum wheat genotypes. Different letters (a–c) indicate significant differences among genotypes for the TPC (p ≤ 0.05). Different letters (A–C) indicate significant differences among genotypes for the TFC (p ≤ 0.05). Bars indicate ± standard error. DM: dry matter.


