Fig. 1.
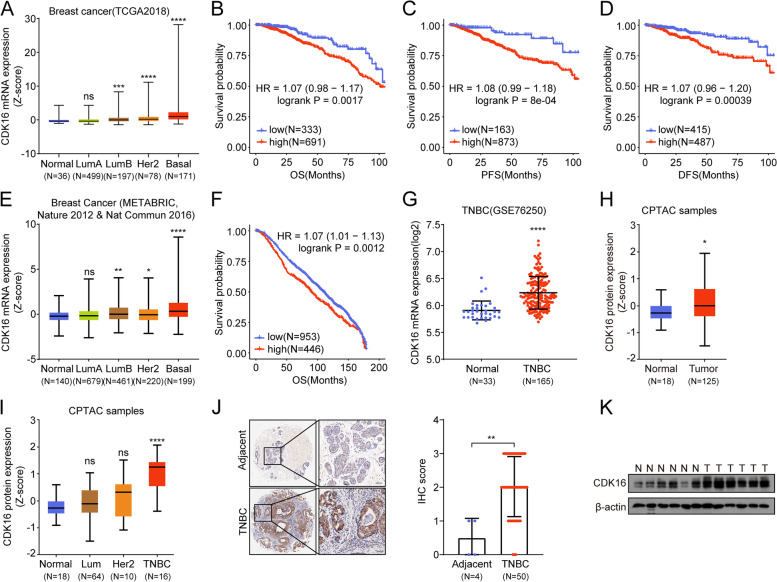
CDK16 is highly expressed in TNBC and is correlated with poor clinical outcomes. A-D Clinical relevance analysis of CDK16 using data from TCGA breast cancer dataset. Shown are CDK16 mRNA expression profile in different molecular subtypes of breast cancer (A) and Kaplan-Meier curves of OS (B), PFS (C), and DFS (D) of breast cancer patients stratified by CDK16 mRNA levels. E-F Clinical relevance analysis of CDK16 using data from combined databases of METABRIC, Nature 2012 and Nature Communication 2016. Shown are CDK16 mRNA expression pattern (E) and overall survival analysis (F). G CDK16 mRNA expression level in normal breast tissues and in TNBC tissues of patients in GSE76250 dataset. H-I CDK16 protein expression in normal and breast cancer tissues (H), and in distinct breast cancer subtypes (I) of CPTAC samples. J Representative immunohistochemical staining images of TNBC and adjacent tissues elucidated by CDK16 antibody (left panel, scale bar: 50 μm) and statistical analysis of immunohistochemical staining intensity (right panel). The commercial tissue microarray used in (J) was from Zhongke Guanghua (Xi’an) Intelligent Biotechnology Co., Ltd. K Immunoblot analysis of CDK16 protein expression in clinical non-cancerous (N) and TNBC (T) samples collected from Zhongnan Hospital of Wuhan University. Error bars represent mean ± SD. p values were obtained by log rank test (B, C, D, and F) or two-tailed Student’s t-test (others). All *p < 0.05, ** p < 0.01, ***p < 0.001, **** p < 0.0001, ns, not significant

