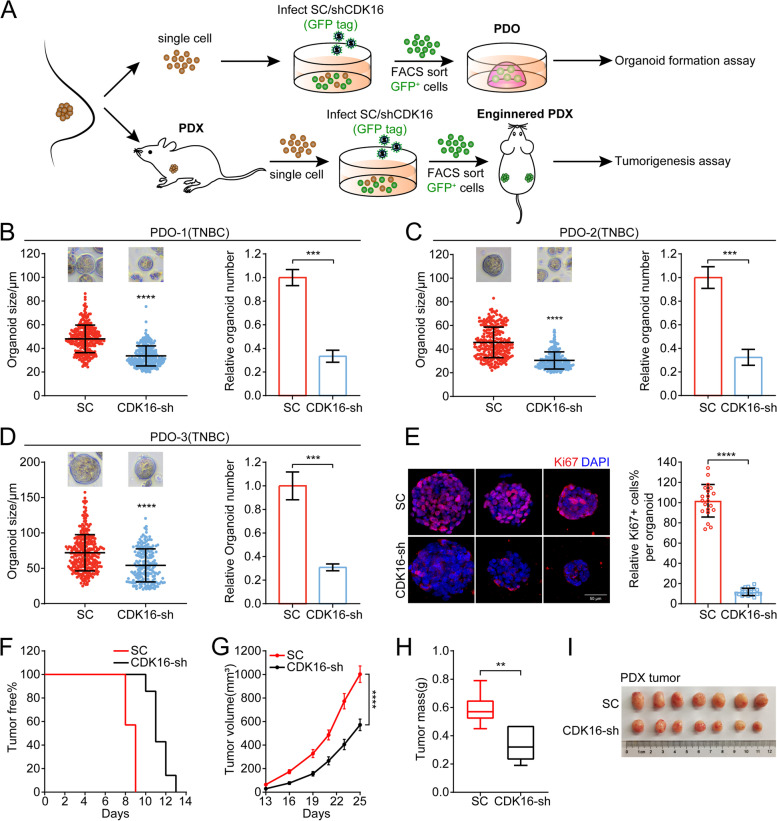
Fig. 3.
Knockdown of CDK16 suppresses tumor progression of TNBC in patient-derived organoid and xenograft models. A Illustration of the establishment of PDO and PDX with CDK16-KD. B-D Organoid formation assay for three independent TNBC PDO models when CDK16 was knocked down. Shown are statistics of tumor organoid size (left) and relative number of formed organoids (right). E Immunostaining for Ki67 (red) and DAPI (blue) of control and CDK16-KD organoids in PDO-3. Shown are representative images (left, scale bar: 50 μm) and a bar graph of the proportion of Ki67+ cells per organoid (right). F-I PDX lines stably transfected with scramble-shRNA or CDK16-shRNA were orthotopically transplanted into the mammary fat pads of nude mice (n = 4 mice per group) for tumorigenesis assay. Shown are tumor-free survival curve (F), tumor growth curve (G), statistics of tumor weight (H), and image of tumors (I). Data are presented as mean ± SD (B, C, D, and E), mean ± SEM (G), or boxplot (H). p values were obtained by repeated measures two-way ANOVA (G) or two-tailed Student’s t-test (others). All *p < 0.05, ** p < 0.01, ***p < 0.001, **** p < 0.0001, ns, not significant

