Fig. 4.
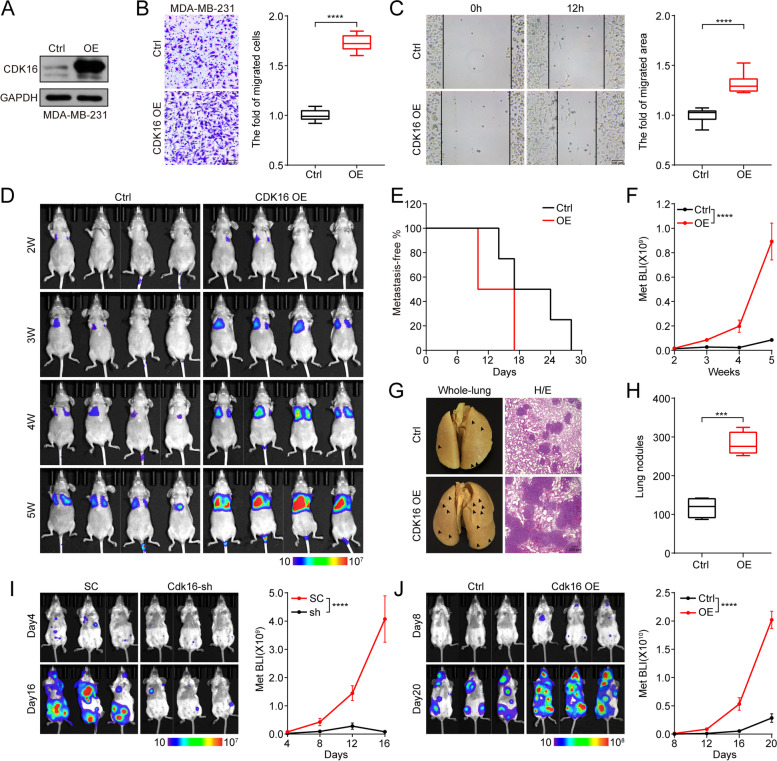
CDK16 promotes TNBC cell migration and tumor metastasis. A-C Immunoblot analysis to verify the overexpression of CDK16 (A), trans-well invasion assay (B, scale bar: 100 μm) and wound-healing assay (C, scale bar: 100 μm) of CDK16-OE MDA-MB-231 cells. D-H Intravenous injection of MDA-MB-231 stable lines transfected with control or CDK16-expressing vector into nude mice for lung metastasis analysis (n = 4 mice per group). Shown are BLI images (D), metastasis-free survival curve (E), quantification of lung metastasis by BLI (F), representative images of metastasized whole-lungs (left, arrows indicate lung nodules) and H/E staining of metastasized lung sections (right, scale bar: 200 μm) (G), and statistics of nodules on metastasized lung surface (H). I-J Left cardiac ventricle injection of 4 T1 stable lines transfected with scramble-shRNA or CDK16-shRNA (I), and EMT6 stable lines transfected with control or CDK16-overexpressing vector (J) into BALB/c mice for systemic metastasis analysis (n = 3 mice per group). Shown are BLI images (left) and quantification of whole-body metastasis by BLI (right). Data are presented as boxplot (B, C, and H) or mean ± SEM (F, I, and J). p values were obtained by two-tailed Student’s t-test (B, C, and H) or repeated measures two-way ANOVA (F, I, and J). All *p < 0.05, ** p < 0.01, ***p < 0.001, **** p < 0.0001, ns, not significant

