Fig. 7.
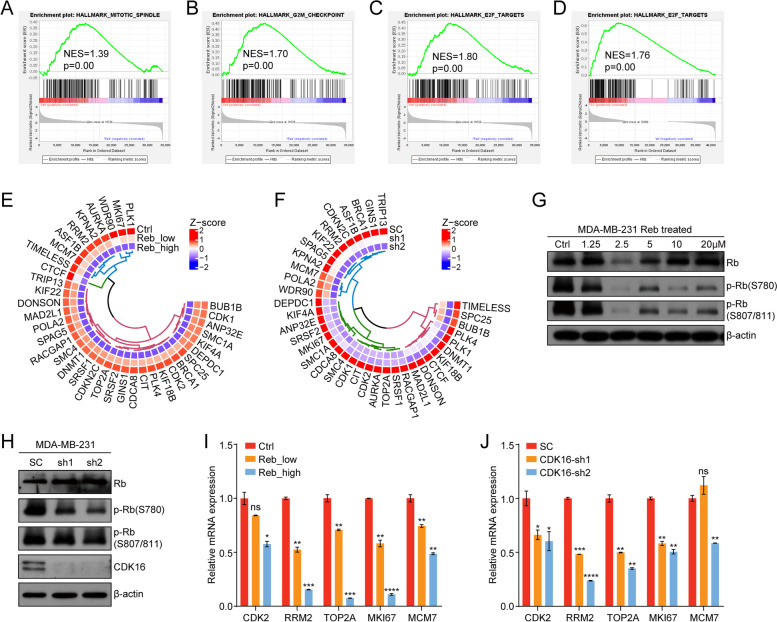
CDK16 inhibition is involved in multiple cancer-related signaling pathways. A-B GSEA analysis using RNA-seq data of MDA-MB-231 cells treated with low (1 μM) or high concentrations (5 μM) of Reb for 48 h. The GSEA plots showed mitotic spindle (A) and G2/M checkpoint signatures (B) were enriched in the control group. C-D GSEA analysis using RNA-seq data of MDA-MB-231 cells with Reb treatment (C) or with CDK16-KD (D). The GSEA plots showed E2F targets were enriched in the control groups. E-F Heat map shows the Z-score normalized expression of the most affected E2F target genes in MDA-MB-231 cells upon Reb treatment (E) or with CDK16-KD (F) according to RNA-seq data. The displayed genes are the intersection of the core enrichment genes from the GSEA analysis shown in (C) and (D). G-H Immunoblot analysis of total Rb and p-Rb expression in MDA-MB-231 cells treated with indicated concentrations of Reb for 48 h (G) or with CDK16-KD (H). I-J qPCR analysis of Rb-E2F direct targets expression in MDA-MB-231 cells treated with Reb_low (1 μM) or Reb_high (5 μM) for 48 h (I) or with CDK16-KD (J). Data are presented as mean ± SD and p values were obtained by two-tailed Student’s t-test (I and J). *p < 0.05, ** p < 0.01, ***p < 0.001, **** p < 0.0001, ns, not significant

