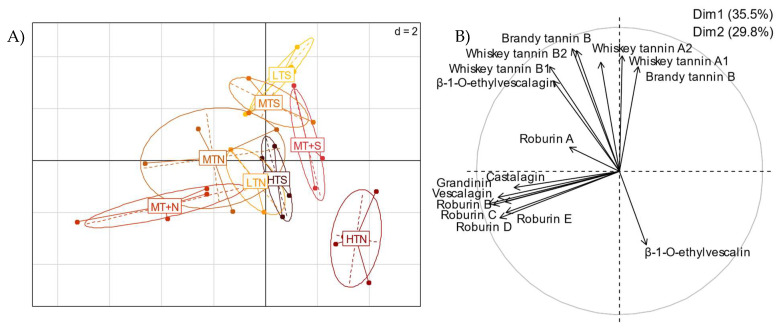
Figure 7.
Principal component analysis (PCA) on two dimensions after 18 months of aging representing (A) the distribution map of the individuals according to toasting level (LT: Light Toasting; MT: Medium Toasting; MT+: Medium Toasting Plus; HT: High Toasting; N: Normal; S: Slow) and (B) the correlation circle of the associated variables.

