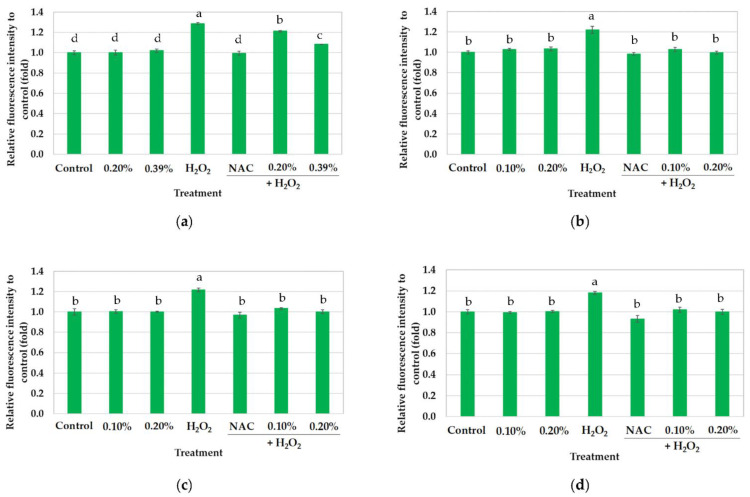
Figure 2.
Intracellular ROS scavenging capacity under variable CRBO concentrations (0–0.39%). The results are expressed as fold of DCF fluorescence over the control, where control is cells treated with 100 µL DMEM without H2O2: (a) hexane extraction (HE); (b) cold press extraction (CE); (c) thermally pretreated cold press extraction (CCE); (d) ultrasound-pretreated cold press extraction (UCE). The values are the mean of three replications ± standard deviation. Different superscripts on bars indicate statistical differences between treatments (p < 0.05).

