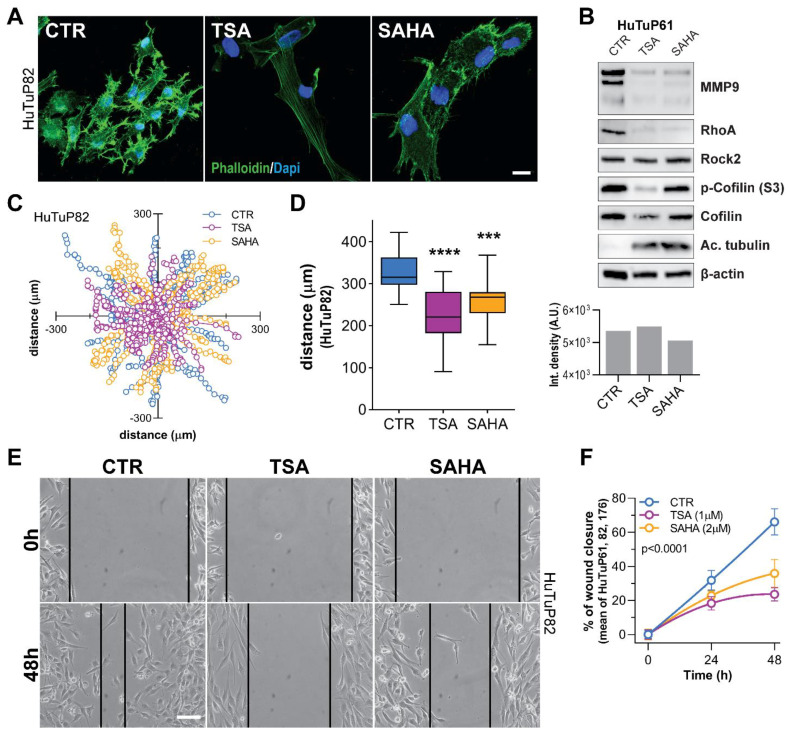
Figure 6.
HDI induce cytoskeletal rearrangements and RhoA-GTPase-dependent inhibition of cell motility/migration. (A) Representative immunofluorescence images of HuTuP82 GBM cells displaying cytoskeletal (phalloidin, green) alterations associated with TSA (1 μM) and SAHA (2 μM) treatments for 72 h. Cell nuclei were counterstained with Dapi (blue). Original magnification 20×; bar: 10 μM. (B) Western blot analysis of proteins (as indicated) extracted from HuTuP61 cells treated for 24 h with TSA (5 μM) and SAHA (5 μM) (upper panel), and bar graph reporting total protein quantitation (integrated density) by Coomassie staining of same samples). The original Western blot images included in (B) are provided in Supplementary Figure S6B. (C,D) Graph representing the normalized (x, y) trajectories of control and HDI-treated (1 μM TSA and 2 μM SAHA) GBM cells moving within the plate in a 16-h timespan (C), and box plot summarizing the total length covered by cells in the same time interval (HuTuP82) (D). *** p < 0.001, **** p < 0.0001 by one-way ANOVA multiple comparison test. (E,F) Representative images demonstrating the inhibitory effect displayed by HDI (1 μM TSA and 2 μM SAHA) on the ability of GBM cells (HuTuP82) to close the wound during a scratch assay (E), and relative quantification of the scratch closure assay performed in the HuTuP61, HuTuP82, and HuTuP176 GBM cells (F). Original magnification 10×; bar: 50 μM.

