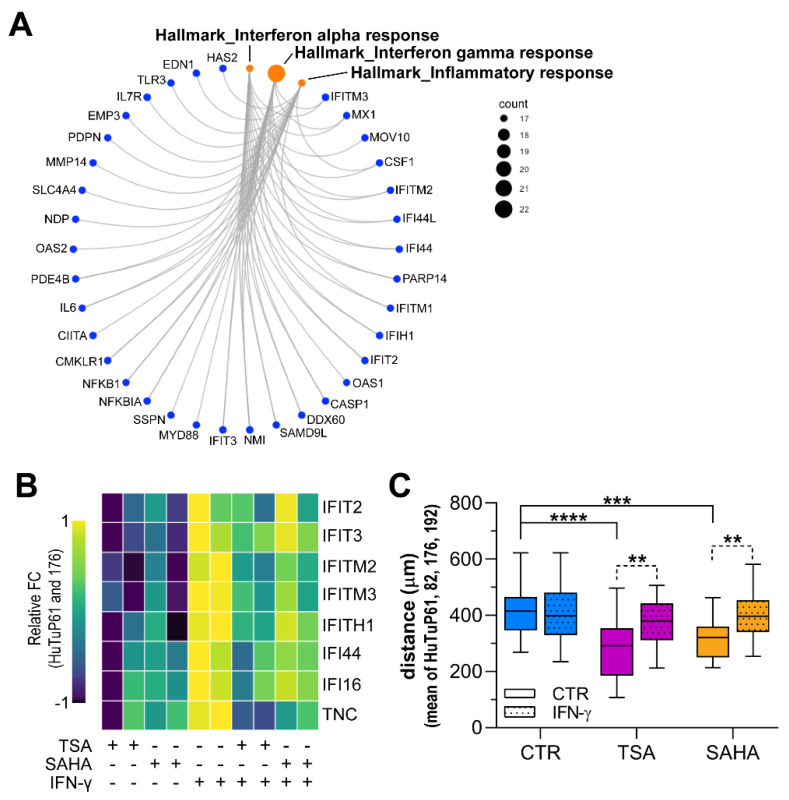
Figure 7.
HDI-induced inhibition of cell motility is partially dependent on IFN target gene suppression. (A) Circle plot representing HDI-induced DEGs contributing to a significant negative enrichment (FDR q value < 0.05) of the transcriptional Hallmarks (Hallmarks gene sets from MSigDB) correlated to the IFN-α/γ and inflammatory responses. (B) Heatmap summarizing the relative expression of a series of IFN/inflammation signaling target genes as indicated when GBM cells (HuTuP61, 176) were exposed to TSA (5 μM), SAHA (5 μM), IFN-γ (1 μg/mL), or a combination of them for 24 h. (C) Box plot summarizing the total length covered by cells (HuTuP61, 82, 176, 192, 197) when treated with TSA (1 μM) and SAHA (2 μM) (combined or not with 1 μg/mL IFN-γ) during a 16-h live imaging experiment. ** p < 0.01, *** p < 0.001, **** p < 0.0001 by t test or one-way ANOVA multiple comparison test.

