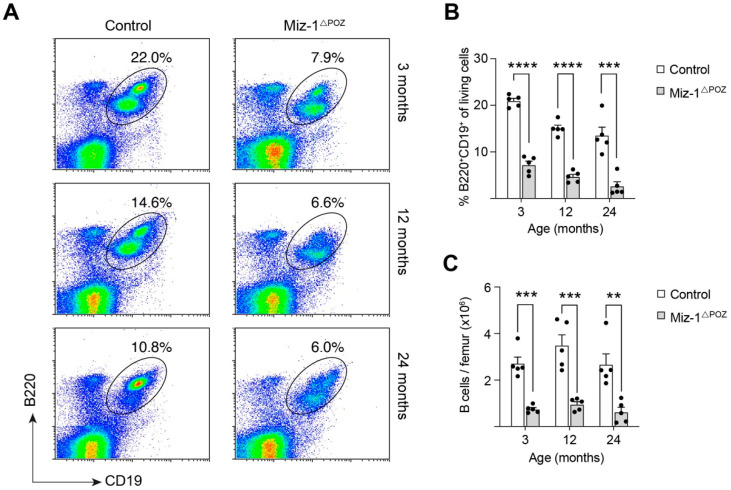
Figure 1.
Age-related decline in bone marrow B cells. (A) Flow cytometric analysis of bone marrow cells from control and Miz-1ΔPOZ mice. Cells were analyzed with antibodies for B220 and CD19. Cells are pre-gated for debris and doublet exclusion. Percentages in dot plots are given for the respective gates. (B) Frequency of B cells (B220+CD19+) from bone marrow of control and Miz-1ΔPOZ mice. (C) Quantification B cells (B220+CD19+) from bone marrow of control and Miz-1ΔPOZ mice, corrected to the number of living cells. One point represents one mouse. Data are expressed as mean + SD (n = 5). Student’s unpaired t-test: ** p < 0.01 *** p < 0.001, **** p < 0.0001. For (A), plots are representative of at least five independent experiments.

