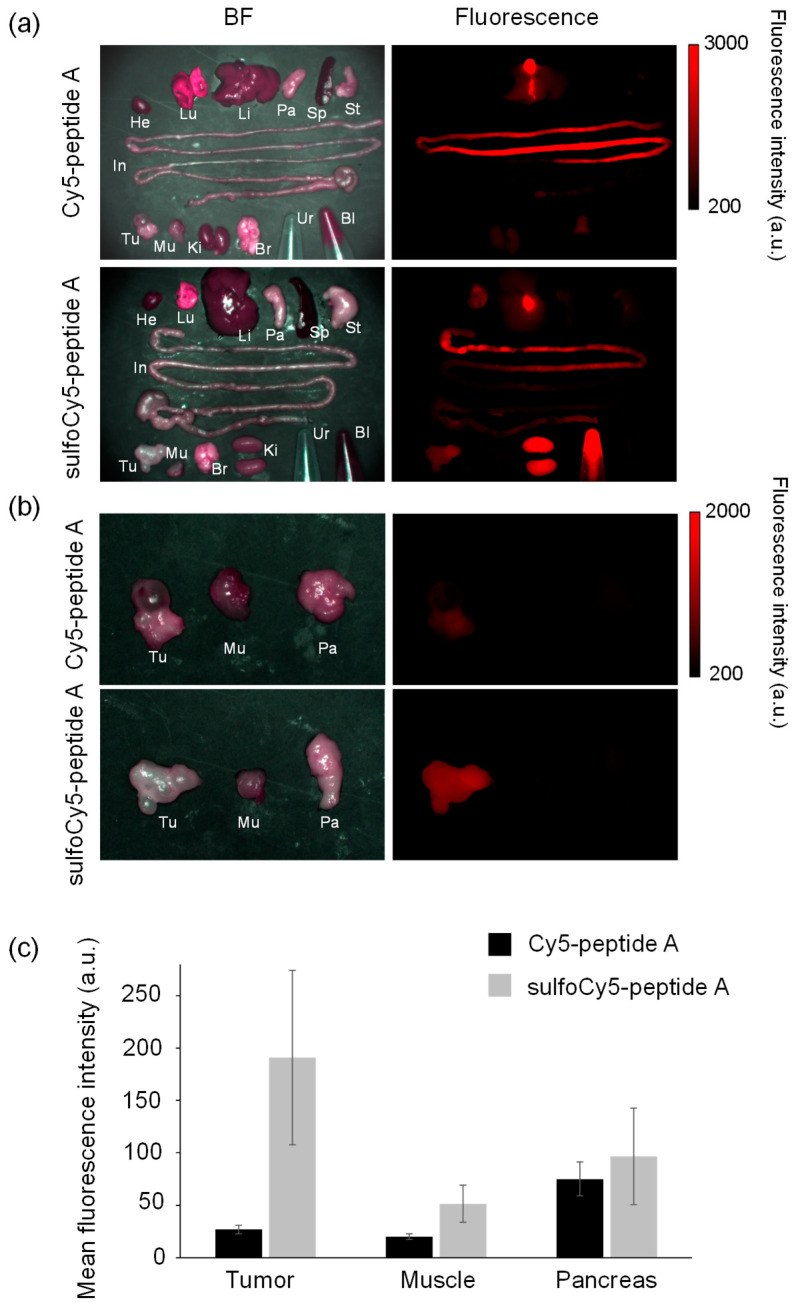
Figure 6.
Ex vivo fluorescence imaging of organs collected from tumor-bearing mice injected with dye-peptide A. He, heart; Lu, lung; Li, liver; Pa, pancreas; Sp, spleen; St, stomach; In, intestine; Br, brain; Ki, kidney; Mu, muscle; Tu, tumor; Ur, urine; Bl, blood. Comparison of (a) all organs, urine, and blood, and (b) tumors, muscle, and pancreases. (c) The comparison of the mean fluorescence intensity of tumors, muscle, and pancreases. The data represent the mean ± SEM (n = 3).

