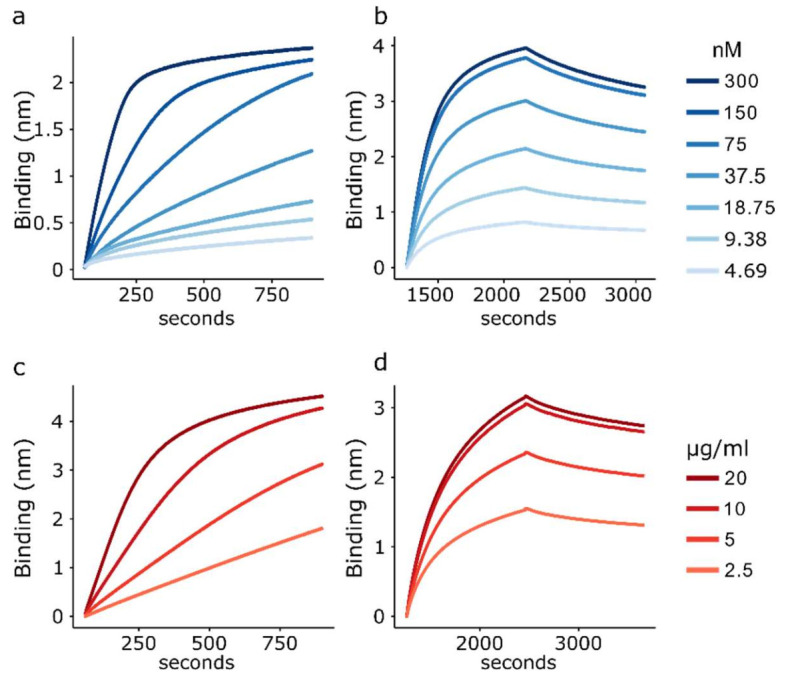
Figure 3.

Biosensor loading with FMDV antigens. (a) BLI curves reflecting the loading of biotinylated peptide (ligand) onto the sensor surface. (b) Association and dissociation curves reflecting the interactions between Octet biosensors loaded with peptide and the D9 monoclonal antibody. Note: the 150 and 75 nM curves overlap. (c) Response levels observed when loading biosensors with different concentrations of recombinant capsid (2.5–20 µg/mL). (d) Reactivity of O1 Manisa polyclonal sera with biosensors functionalised with the different amounts of recombinant capsid.
