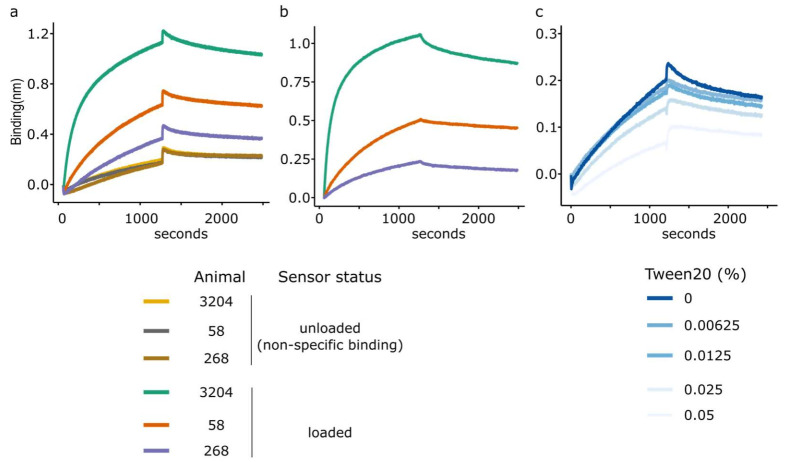
Figure 4.
Non-specific binding (NSB) to Octet biosensors. (a) Un-referenced BLI association/dissociation curves indicating the difference between the loaded and unloaded sensors (dark colours) highlighting NSB for three bovine sera (3204, 58 and 268). (b) Double referenced curves following the subtraction of the unloaded reference sensors. (c) Non-specific interactions in serum from sample 3204 (diluted 1:100) with unloaded sensors in kinetics buffer modified with various concentrations of Tween 20 giving a range of 0.00625–0.05%.

