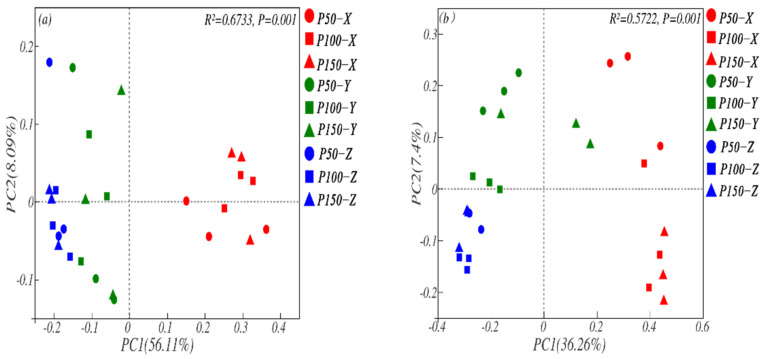
Figure 5.
PCoA of bacterial (a) and fungal (b) communities at the OUT level under different treatments. R2 and p value represents the difference between different samples of treatments. The closer R2 is to 1, the more obvious the difference between samples. p < 0.01 means significant difference between samples.

