Figure 6.
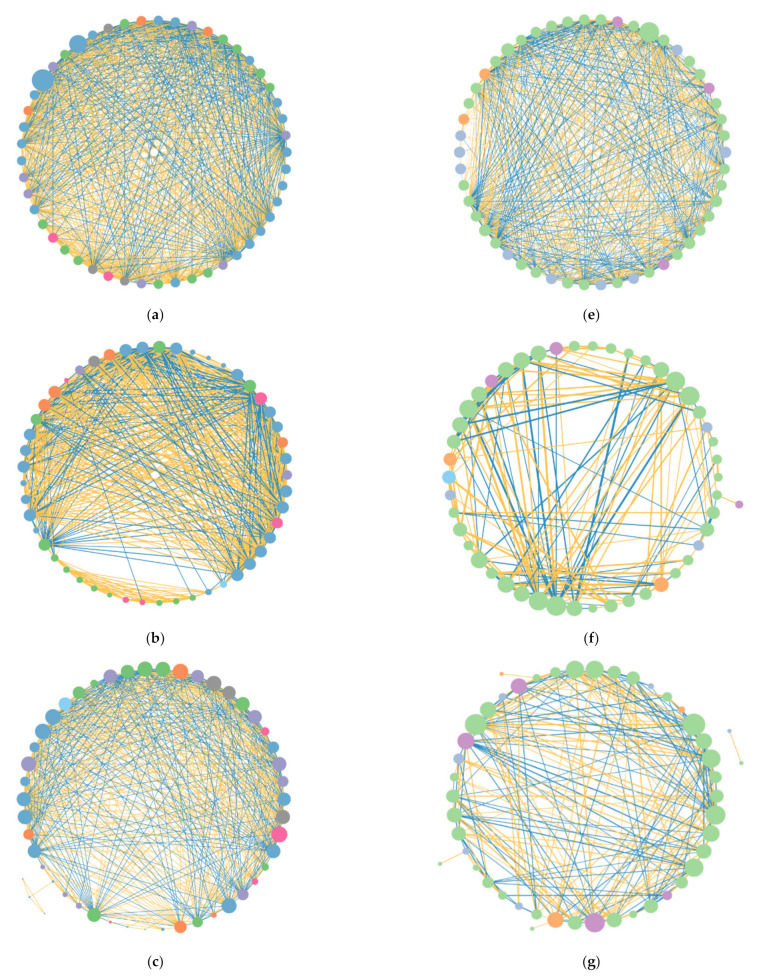
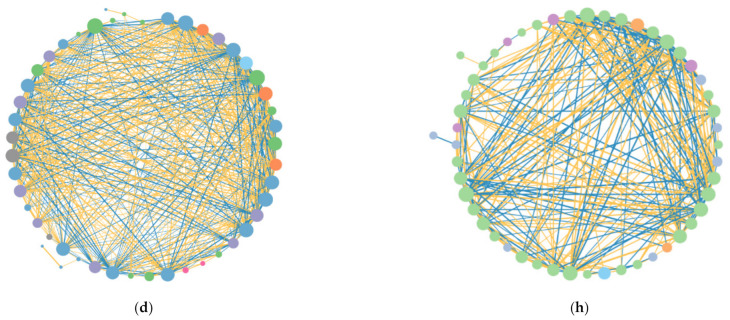
The interactions among soil bacterial (a–d) and fungal (e–h) OTUs under different precipitation treatments. (a,e): the total numbers of soil bacterial/fungal; (b,f): the numbers of soil bacterial/fungal under P50; (c,g) the numbers of soil bacterial/fungal under P100; (d,h) the numbers of soil bacterial/fungal under P150. The node size is proportional to its degree. The line between each pair of nodes represents a strong positive (yellow) or negative (blue) interaction with adjusted p < 0.05. The width of the line is the Spearman coefficient size. Only the top 50 most abundant OTUs participated in the analysis.


