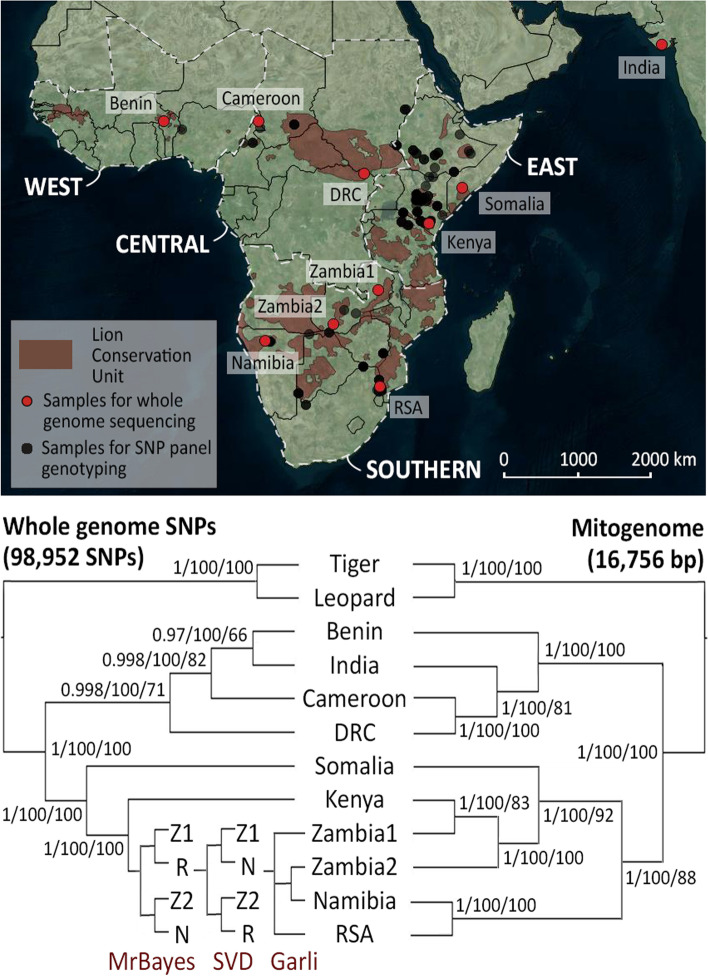
Fig. 1.
Distribution of lion sampling localities and inferred phylogenetic relationships between populations. Map indicating sampling locations of lions for whole genome sequencing (red) and SNP panel genotyping (black) (top). Red shading indicates Lion Conservation Units, and white delineation defines the regions (West, Central, East, and Southern), sensu the lion conservation strategies [31]. Phylogenetic trees, based on 98,952 nuclear SNPs (left) and 16,756 bp mitogenomes (right) for 10 lions which were subjected to whole genome sequencing (bottom). Support values indicate posterior probabilities (MrBayes), bootstrap support from SVDquartets and bootstrap support from Garli. Topologies are indicated per method in the southern branch of the autosomal SNP tree, and each split is maximally supported, with the exception of the Zambia2 + Namibia branch in the Garli tree, which received a bootstrap support of 96. Z1: Zambia1, Z2: Zambia2, N: Namibia, R: RSA. Base map from Bing Maps through OpenLayers plugin in QGIS 18.26

