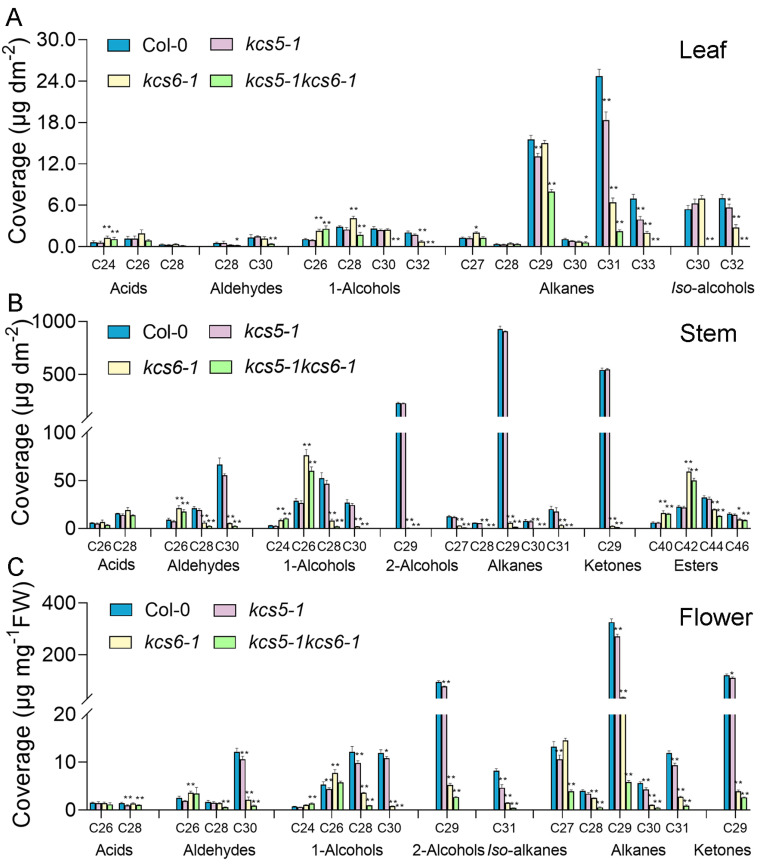
Figure 4.
Wax profile in different organs of different plants. Rosette leaves (A), stems (B), and flowers (C) of Col-0, kcs5-1, kcs6-1, and kcs5-1 kcs6-1 were collected for wax analysis. Wax coverage is expressed as wax amounts per leaf surface area (μg.dm−2). Each wax constituent was designated by carbon chain length and was labeled by chemical class along the x-axis. The values shown are means ± SD (n = 4). * p < 0.05; ** p < 0.01.

