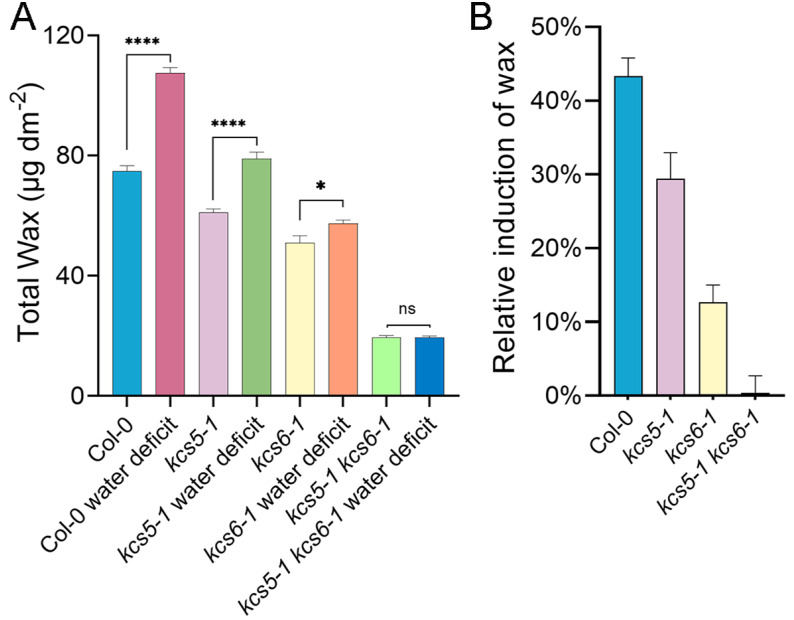
Figure 6.
Wax production of different plants in response to water deficit conditions. Wax analysis was performed in different plants grown under normal and water deficit conditions (A). Total wax amounts of plants grown under different conditions are shown (B). The values shown are means ± SD (n = 4). The experiments were repeated once with similar results. * p < 0.05; **** p < 0.0001.

