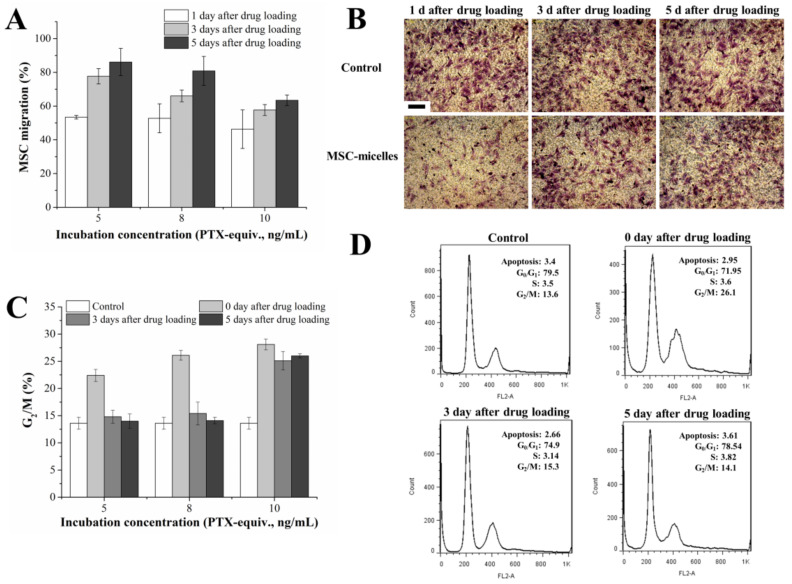
Figure 4.
(A) Migratory activity of MSC-micelles with different drug loading and recovery times. The numbers of the migrating MSCs were counted. Cells incubated with the blank micelles were set as the control. (B) Representative images of migrated MSCs incubated with 8 ng/mL PTX/HA-PLGA micelles through the membrane pores; 1, 3, 5 days after MSC-micelles seeding to the upper chamber of the transwell system, the migrated MSCs were stained by crystal violet (bar = 300 µm). (C) The percentage of MSC-micelles arrested in G2/M phase 0, 3, 5 days after incubation with 5, 8, 10 ng/mL PTX/HA-PLGA micelles. (D) Cell cycle analysis of MSCs recovered from exposure to 8 ng/mL PTX/HA-PLGA micelles.

