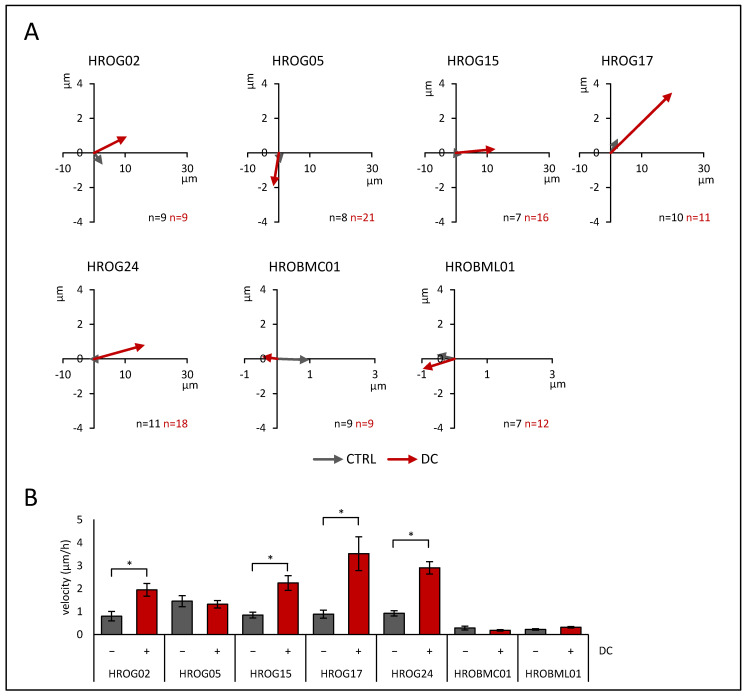
Figure 1.
Migration in the DC electrical field of glioblastoma cells (HROG02, HROG05, HROG15, HROG17, and HROG24) and brain metastases cells (HROBMC01 and HROBML01). Tumor cells were seeded on collagen-coated coverslips that were mounted in DC chambers. Position of cells after DC stimulation was estimated as described in the Materials and Methods section in detail. (A) Sum vectors of migration distance after 6 h of DC stimulation (red) and control cultures (CTRL, gray). Please note different scaling of x-axis between glioblastoma and brain metastases cells. Positive values in x-dimension imply anodal migration. (B) Absolute value of the mean velocity of migration ± DC (mean: 200 V/m). Data are presented as mean ± SEM (n = 7–21 separate biological replicates; up to 40 cells were analyzed per biological replicate); * p < 0.05 versus control cultures w/o DC (Mann–Whitney U test).

