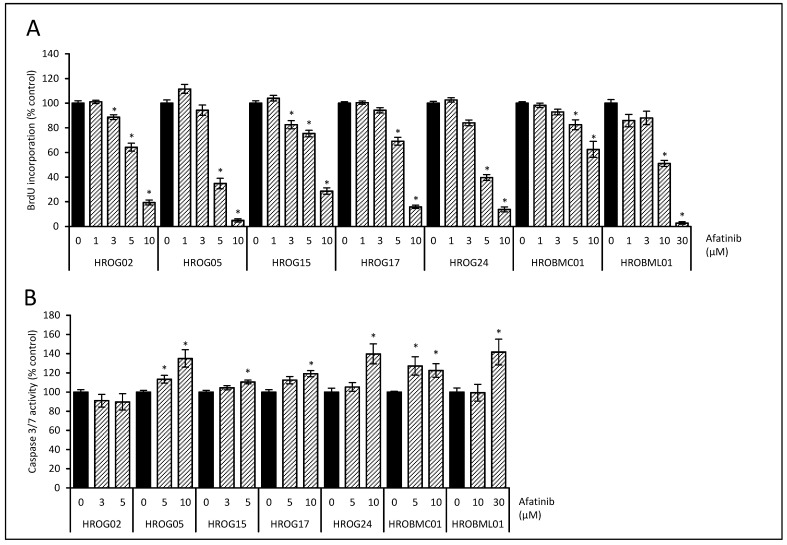
Figure 3.
Effects of the EGF receptor inhibitor afatinib on cell proliferation and apoptosis. (A) Glioblastoma cells (HROG02, HROG05, HROG15, HROG17, and HROG24) and brain metastasis cell (HROBMC01 and HROBML01) growing in 96-well half-area microplates were treated with afatinib (striated bars) or solvent (black bars) for 48 h, before DNA synthesis was assessed with the BrdU incorporation assay. One hundred percent BrdU incorporation corresponds to cells cultured with solvent only. Data are presented as mean ± SEM (n ≥ 18 separate cultures); * p < 0.05 versus control cultures (Kruskal–Wallis test with post hoc Dunn’s test). (B) Subconfluent-growing glioblastoma cells were challenged with afatinib (striated bars) or solvent control (black bars) for 6 h followed by caspase 3/7 enzyme activity quantification. Data are presented as mean ± SEM (n ≥ 9 separate cultures for caspase activity assay); * p < 0.05 versus control cultures (Kruskal–Wallis test with post hoc Dunn’s test).

