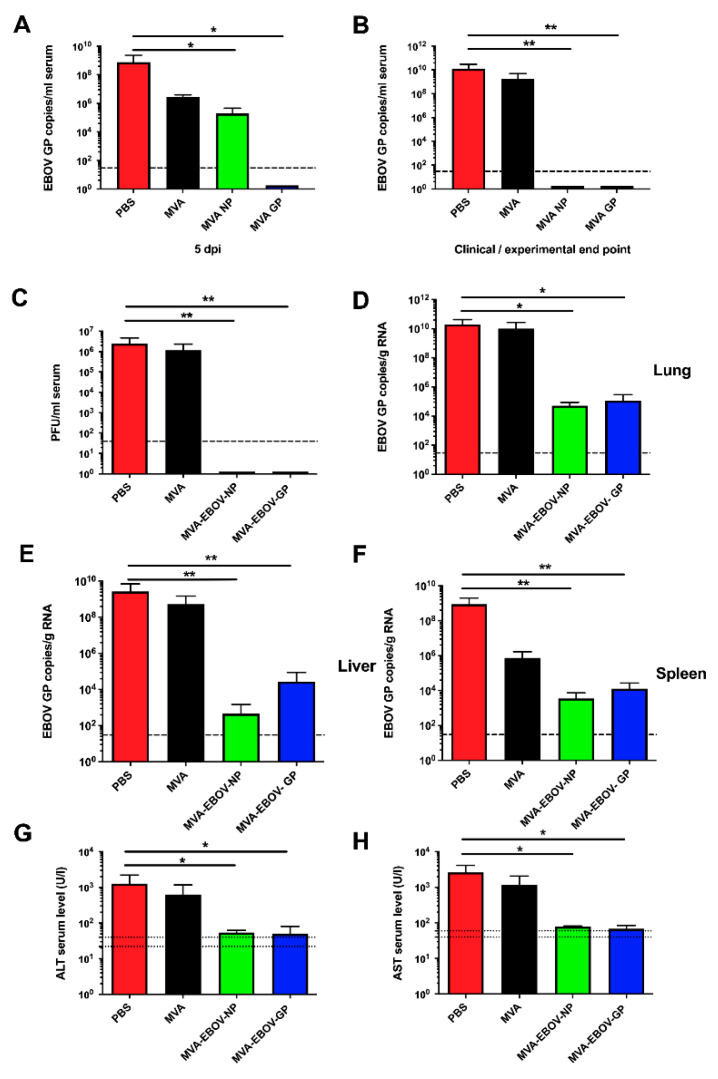
Figure 4.
EBOV loads and clinical chemistry in infected mice. EBOV GP RNA copies in the sera at 5 dpi (days post infection) (A) or at the clinical (PBS, MVA: 7 or 8 dpi) or experimental (MVA-EBOV-NP, MVA-EBOV-GP: 14 dpi) end point (B). (C) Infectious EBOV in the sera at the clinical end point. EBOV GP RNA copies in lung (D), liver (E) and spleen (F) at the clinical end point; dashed lines: limit of detection; PBS, MVA-EBOV-GP, MVA-EBOV-NP: n = 5 mice, MVA: n = 3 mice. (G) ALT (alanine aminotransferase) and (H) AST (aspartate aminotransferase) levels at the clinical end point; dotted lines: physiological range. Error bars: standard deviation; PBS: n = 5, MVA: n = 4, MVA-EBOV-GP, MVA-EBOV-NP: n = 2 mice; * p < 0.05; ** p < 0.01 (one-tailed).

