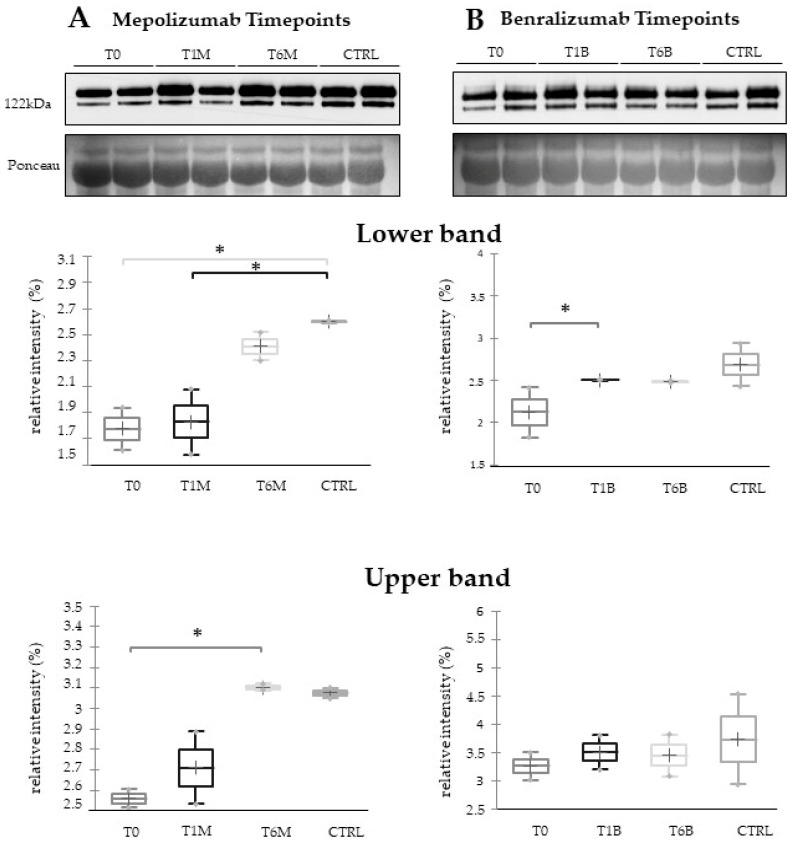
Figure 7.
The 1D-Western blot analysis with anti-ceruloplasmin monoclonal antibody on serum samples from SEA patients at T0, T1M, and T6M (A) or T0, T1B, and T6B (B) and CTRLs. Kruskal–Wallis statistical analysis validates the lower band upregulation of ceruloplasmin in T1B serum and the upper band upregulation of ceruloplasmin in T6M serum. * Indicates significant level p < 0.05.

