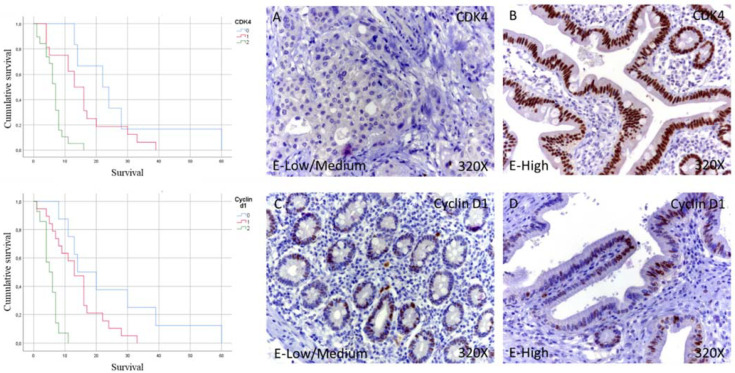
Figure 1.
Kaplan–Meier curves for survival time according to tumor expression (left) and images showing the protein expression of CDK4 and Cyclin-D1 in patients diagnosed with pancreatic cancer (right A–D). E-Low/Medium = tissue expression classified as low/medium; E-High = tissue expression classified as high; 320× magnification. Histological samples from patients diagnosed with pancreatic cancer were classified as negative expression (0), low/medium (1), and high (3) using the IRS Score method n = 41.

