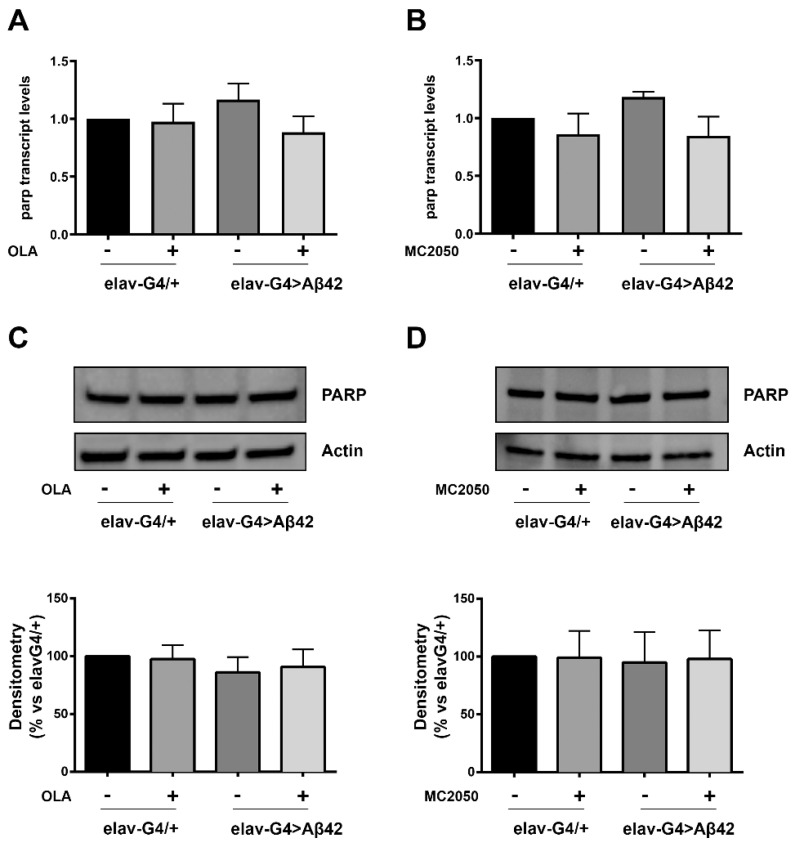
Figure 5.
(A,B) qRT-PCR analysis assessing induction levels of PARP-1 transcript following olaparib (A) or MC2050 (B) treatments. cDNA was prepared from total RNA purified from AD (elav-Gal4 > Aβ42) and control (elav-Gal4/+) head tissues, treated (or not) with PARP-1 inhibitors. The constitutive rp49 was examined as an endogenous control. The data are expressed as “fold enrichment” with respect to elav-Gal4/+ and represent the mean ± SEM of three independent experiments. Statistical analysis, determined by unpaired t-test, showed no significant difference between means. (C,D) Western blot analysis of head protein extracts from elav-Gal4/+ and elav-Gal4 > Aβ42 flies, treated or not with olaparib (C) or MC2050 (D), probed with PARP-1 specific antibody. Densitometry analysis was performed using ImageLab software and normalized to Actin. The data are expressed as a percentage of the elavG4/+ control values and represent the mean ± SEM of at least three independent experiments. Two-way ANOVA followed by the Tukey test for multiple comparisons showed no significant differences among the means of the different groups.

