Figure 4.
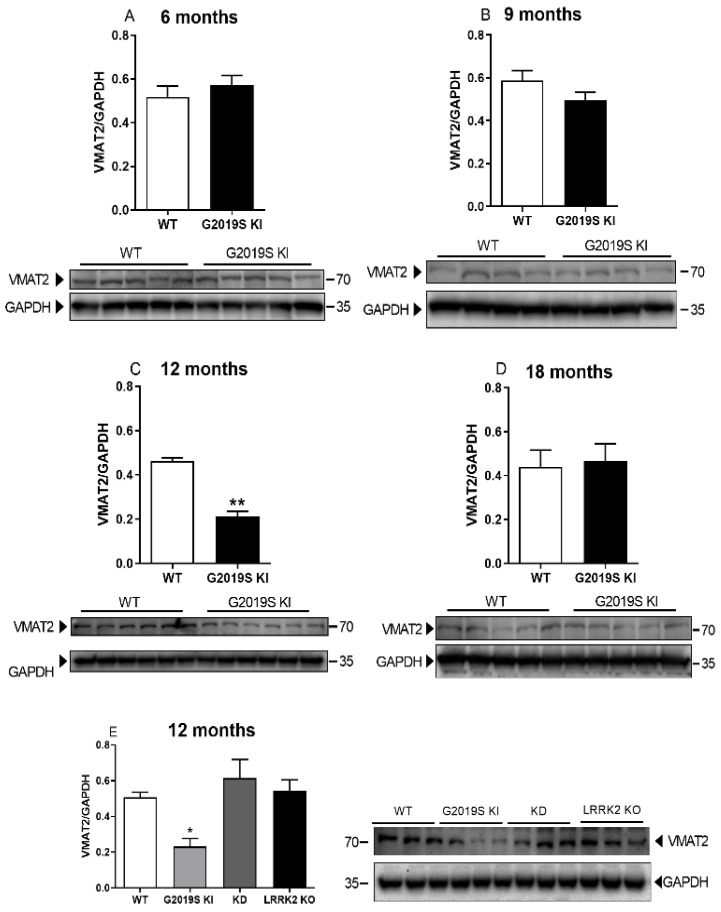
The reduction of VMAT2 levels in G2019S KI mice appears at 12 months and is associated with the G2019S mutation. Western blot analysis of VMAT2 levels in the striatum of 6-month-old (A), 9-month-old (B), 12-month-old (C) and 18-month-old (D) G2019S KI mice versus age-matched WT controls, and representative blots. (E) Western blot analysis of VMAT2 levels in the striatum of 12-month-old G2019S KI mice versus age-matched LRRK2 KO, KD and WT mice, and representative blots. Data are expressed as mean ± SEM of n = 6 animals per group. Statistical analysis was performed using the Student t-test, two-tailed for unpaired data (A–D) or one-way ANOVA (E) followed by the Tukey test for multiple comparisons. * p < 0.05, ** p < 0.01 different from WT.

